
Page 108 - Handbook of Thermal Analysis of Construction Materials
P. 108
Section 6.0 - Hydration 91
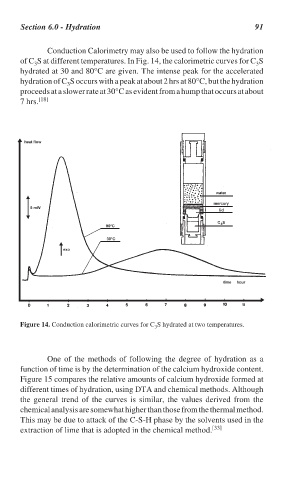
Conduction Calorimetry may also be used to follow the hydration
of C S at different temperatures. In Fig. 14, the calorimetric curves for C S
3
3
hydrated at 30 and 80°C are given. The intense peak for the accelerated
hydration of C S occurs with a peak at about 2 hrs at 80°C, but the hydration
3
proceeds at a slower rate at 30°C as evident from a hump that occurs at about
7 hrs. [18]
Figure 14. Conduction calorimetric curves for C S hydrated at two temperatures.
3
One of the methods of following the degree of hydration as a
function of time is by the determination of the calcium hydroxide content.
Figure 15 compares the relative amounts of calcium hydroxide formed at
different times of hydration, using DTA and chemical methods. Although
the general trend of the curves is similar, the values derived from the
chemical analysis are somewhat higher than those from the thermal method.
This may be due to attack of the C-S-H phase by the solvents used in the
extraction of lime that is adopted in the chemical method. [33]