
Page 109 - Handbook of Thermal Analysis of Construction Materials
P. 109
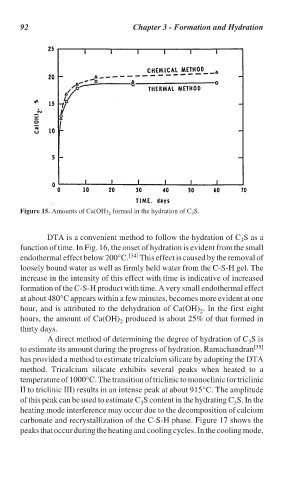
92                            Chapter 3 - Formation and Hydration


                              Figure 15. Amounts of Ca(OH)  formed in the hydration of C S.
                                                     2                     3

                                     DTA is a convenient method to follow the hydration of C S as a
                                                                                         3
                              function of time. In Fig. 16, the onset of hydration is evident from the small
                              endothermal effect below 200°C. [34]  This effect is caused by the removal of
                              loosely bound water as well as firmly held water from the C-S-H gel. The
                              increase in the intensity of this effect with time is indicative of increased
                              formation of the C-S-H product with time. A very small endothermal effect
                              at about 480°C appears within a few minutes, becomes more evident at one
                              hour, and is attributed to the dehydration of Ca(OH) . In the first eight
                                                                              2
                              hours, the amount of Ca(OH)  produced is about 25% of that formed in
                                                        2
                              thirty days.
                                     A direct method of determining the degree of hydration of C S is
                                                                                           3
                              to estimate its amount during the progress of hydration. Ramachandran [35]
                              has provided a method to estimate tricalcium silicate by adopting the DTA
                              method. Tricalcium silicate exhibits several peaks when heated to a
                              temperature of 1000°C. The transition of triclinic to monoclinic (or triclinic
                              II to triclinic III) results in an intense peak at about 915°C. The amplitude
                              of this peak can be used to estimate C S content in the hydrating C S. In the
                                                                                       3
                                                              3
                              heating mode interference may occur due to the decomposition of calcium
                              carbonate and recrystallization of the C-S-H phase. Figure 17 shows the
                              peaks that occur during the heating and cooling cycles. In the cooling mode,