
Page 449 - Handbook of Battery Materials
P. 449
14.9 Lithium Alloys at Lower Temperatures 421
Y In Li Sn
Y
700
Discharge
600
E equil.
E (mV vs. Li)
500
400 Charge
300
200
0.5 1.0 1.5 2.0 2.5
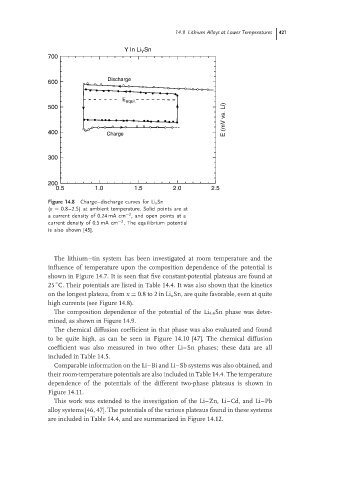
Figure 14.8 Charge–discharge curves for Li x Sn
(x = 0.8–2.5) at ambient temperature. Solid points are at
−2
a current density of 0.24 mA cm , and open points at a
−2
current density of 0.5 mA cm . The equilibrium potential
is also shown [45].
The lithium–tin system has been investigated at room temperature and the
influence of temperature upon the composition dependence of the potential is
shown in Figure 14.7. It is seen that five constant-potential plateaus are found at
◦
25 C. Their potentials are listed in Table 14.4. It was also shown that the kinetics
on the longest plateau, from x = 0.8 to 2 in Li x Sn, are quite favorable, even at quite
high currents (see Figure 14.8).
The composition dependence of the potential of the Li 4.4 Sn phase was deter-
mined, as shown in Figure 14.9.
The chemical diffusion coefficient in that phase was also evaluated and found
to be quite high, as can be seen in Figure 14.10 [47]. The chemical diffusion
coefficient was also measured in two other Li–Sn phases; these data are all
included in Table 14.5.
Comparable information on the Li–Bi and Li–Sb systems was also obtained, and
their room-temperature potentials are also included in Table 14.4. The temperature
dependence of the potentials of the different two-phase plateaus is shown in
Figure 14.11.
This work was extended to the investigation of the Li–Zn, Li–Cd, and Li–Pb
alloy systems [46, 47]. The potentials of the various plateaus found in these systems
are included in Table 14.4, and are summarized in Figure 14.12.