
Page 453 - Handbook of Battery Materials
P. 453
14.10 The Mixed-Conductor Matrix Concept 425
An additional requirement is that the reactant material must have two phases
present in the tie-triangle, but the matrix phase only one. This is another way
of saying that the stability window of the matrix phase must span the reaction
potential, but that the binary titration curve of the reactant material must have a
plateau at the tie-triangle potential. It has been shown that one can evaluate the
possibility that these conditions are met from knowledge of the binary titration
curves, without having to perform a large number of ternary experiments.
The kinetic requirements for a successful application of this concept are readily
understandable. The primary issue is the rate at which the electroactive species
can reach the matrix/reactant interfaces. The critical parameter is the chemical
diffusion coefficient of the electroactive species in the matrix phase. This can be
determined by various techniques, as discussed above.
The first example that was demonstrated was the use of the phase with the
nominal composition Li 13 Sn 5 as the matrix, in conjunction with reactant phases
◦
in the lithium–silicon system at temperatures near 400 C. This is an especially
favorable case, due to the high chemical diffusion coefficient or lithium in the
Li 3 Sn 5 phase.
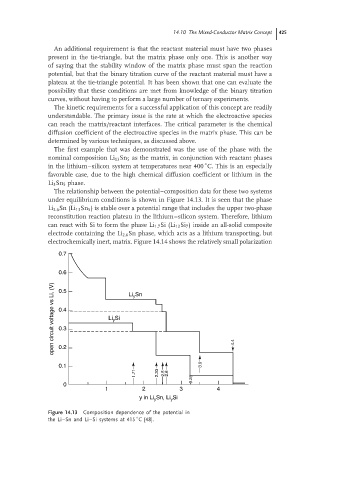
The relationship between the potential–composition data for these two systems
under equilibrium conditions is shown in Figure 14.13. It is seen that the phase
Li 2.6 Sn (Li 13 Sn 5 ) is stable over a potential range that includes the upper two-phase
reconstitution reaction plateau in the lithium–silicon system. Therefore, lithium
can react with Si to form the phase Li 1.7 Si (Li 12 Si 7 ) inside an all-solid composite
electrode containing the Li 2.6 Sn phase, which acts as a lithium transporting, but
electrochemically inert, matrix. Figure 14.14 shows the relatively small polarization
0.7
0.6 Li Sn
open circuit voltage vs Li, (V) 0.4 Li y Si y 4.4
0.5
0.3
0.2
0.1 3.5
1.71 2.33 2.5 2.6
0 3.25
1 2 3 4
y in Li Sn, Li Si
y
y
Figure 14.13 Composition dependence of the potential in
◦
the Li–Sn and Li–Si systems at 415 C [48].