
Page 117 - Handbook of Materials Failure Analysis
P. 117
112 CHAPTER 5 Failure analysis of reinforced concrete structures
21 26 21 26
22 23 24 25 22 23 24 25
20 27 20 27
19 28 19 28
18 29 18 29
17 30 17 30
6 11 6 11
7 8 9 10 7 8 9 10
5 12 5 12
4 13 4 13
3 Case I 14 3 Case II 14
2 15 2 15
32 33 34 35 36 37 38 39 40 41 42
31 1 16 43 1 16
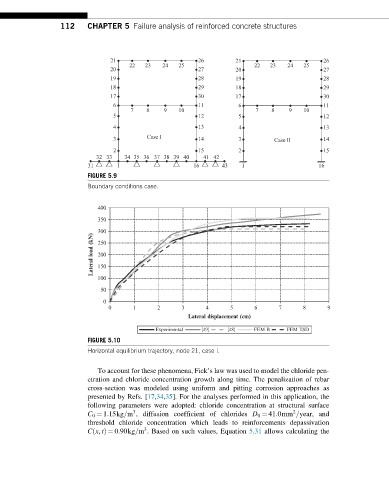
FIGURE 5.9
Boundary conditions case.
400
350
300
Lateral load (kN) 200
250
150
100
50
0
0 1 2 3 4 5 6 7 8 9
Lateral displacement (cm)
Experimental [49] [48] FEM B FEM TSD
FIGURE 5.10
Horizontal equilibrium trajectory, node 21, case I.
To account for these phenomena, Fick’s law was used to model the chloride pen-
etration and chloride concentration growth along time. The penalization of rebar
cross-section was modeled using uniform and pitting corrosion approaches as
presented by Refs. [17,34,35]. For the analyses performed in this application, the
following parameters were adopted: chloride concentration at structural surface
3
2
C 0 ¼ 1:15kg=m , diffusion coefficient of chlorides D 0 ¼ 41:0mm =year, and
threshold chloride concentration which leads to reinforcements depassivation
3
Cx, tÞ ¼ 0:90kg=m . Based on such values, Equation 5.31 allows calculating the
ð