
Page 121 - Handbook of Materials Failure Analysis
P. 121
116 CHAPTER 5 Failure analysis of reinforced concrete structures
350 350
300
300
Resistant load (kN) 250 Resistant load (kN) 250
200
200
150
150
100
100
50
0 50 0
0 2 4 6 8 10 0 2 4 6 8 10
Propagation period (Years) Propagation period (Years)
Failure mode Failure mode
w/c= 0.4 Concrete Bending reinforcement w/c = 0.5 Concrete Bending reinforcement
350 350
300
300
Resistant load (kN) 250 Resistant load (kN) 250
200
200
150
150
100
100
50
0 50 0
0 2 4 6 8 10 0 2 4 6 8 10
Propagation period (Years) Propagation period (Years)
Failure mode Failure mode
w/c= 0.6 Concrete Bending reinforcement w/c = 0.7 Concrete Bending reinforcement
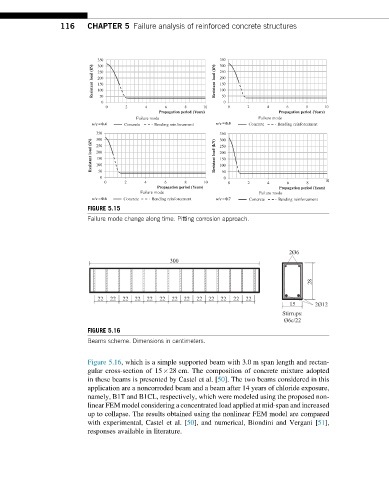
FIGURE 5.15
Failure mode change along time. Pitting corrosion approach.
2Ø6
300
28
22 22 22 22 22 22 22 22 22 22 22 22 22
15 2Ø12
Stirrups:
Ø6c/22
FIGURE 5.16
Beams scheme. Dimensions in centimeters.
Figure 5.16, which is a simple supported beam with 3.0 m span length and rectan-
gular cross-section of 15 28 cm. The composition of concrete mixture adopted
in these beams is presented by Castel et al. [50]. The two beams considered in this
application are a noncorroded beam and a beam after 14 years of chloride exposure,
namely, B1T and B1CL, respectively, which were modeled using the proposed non-
linear FEM model considering a concentrated load applied at mid-span and increased
up to collapse. The results obtained using the nonlinear FEM model are compared
with experimental, Castel et al. [50], and numerical, Biondini and Vergani [51],
responses available in literature.