
Page 122 - Handbook of Materials Failure Analysis
P. 122
7 Applications 117
For this application, the following parameters were adopted: structural cover
depth 10 mm and water/cement ratio 0.5, Castel et al. [50], chloride concentration
3
at structural surface C 0 ¼ 35kg=m , Castel et al. [50], diffusion coefficient of chlo-
2
rides D 0 ¼ 63:07mm =year, Vu and Stewart [35], threshold chloride concentration
3
which leads to reinforcements depassivation Cx, tÞ ¼ 1:10kg=m , Vu and Stewart
ð
2
[35], corrosion rate i corr ¼ 17:81μA=cm , Vu and Stewart [35]. The penalization
of rebar cross-section was modeled using uniform corrosion approach. Based on
these values, Equation 5.31 allows calculating the time for corrosion initiation,
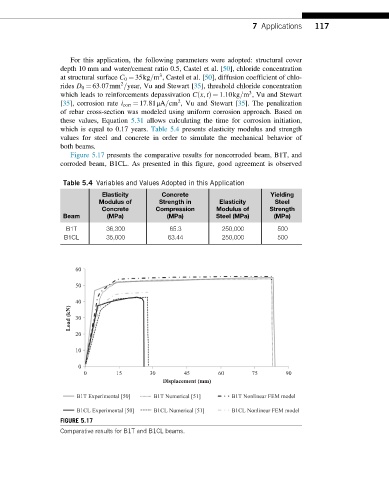
which is equal to 0.17 years. Table 5.4 presents elasticity modulus and strength
values for steel and concrete in order to simulate the mechanical behavior of
both beams.
Figure 5.17 presents the comparative results for noncorroded beam, B1T, and
corroded beam, B1CL. As presented in this figure, good agreement is observed
Table 5.4 Variables and Values Adopted in this Application
Elasticity Concrete Yielding
Modulus of Strength in Elasticity Steel
Concrete Compression Modulus of Strength
Beam (MPa) (MPa) Steel (MPa) (MPa)
B1T 36,300 65.3 250,000 500
B1CL 35,000 63.44 250,000 500
60
50
40
Load (kN) 30
20
10
0
0 15 30 45 60 75 90
Displacement (mm)
B1T Experimental [50] B1T Numerical [51] B1T Nonlinear FEM model
B1CL Experimental [50] B1CL Numerical [51] B1CL Nonlinear FEM model
FIGURE 5.17
Comparative results for B1T and B1CL beams.