
Page 120 - Handbook of Materials Failure Analysis
P. 120
7 Applications 115
As presented in Figures 5.12 and 5.13, it is observed that the water/cement ratio is
directly responsible by the rate of rebar cross-section reduction along time. Accord-
ing to the results obtained, as bigger be the water/cement ratio smaller is the residual
structural load and consequently its residual life.
In addition to that, it was also observed that the pitting corrosion approach pro-
vides more severe steel loss along time when compared to uniform corrosion model.
It is worth to mention that pitting corrosion approach leads to more confident model-
ing when compared to experimental results as the chloride penetration and corrosion
attack do not occur uniformly.
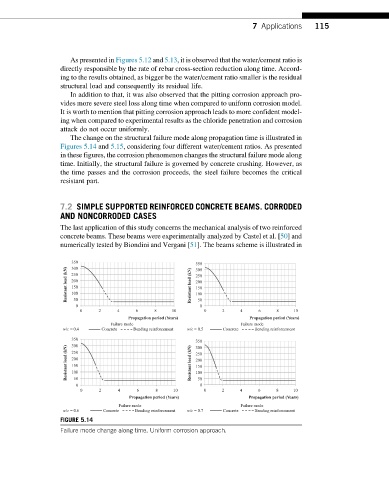
The change on the structural failure mode along propagation time is illustrated in
Figures 5.14 and 5.15, considering four different water/cement ratios. As presented
in these figures, the corrosion phenomenon changes the structural failure mode along
time. Initially, the structural failure is governed by concrete crushing. However, as
the time passes and the corrosion proceeds, the steel failure becomes the critical
resistant part.
7.2 SIMPLE SUPPORTED REINFORCED CONCRETE BEAMS. CORRODED
AND NONCORRODED CASES
The last application of this study concerns the mechanical analysis of two reinforced
concrete beams. These beams were experimentally analyzed by Castel et al. [50] and
numerically tested by Biondini and Vergani [51]. The beams scheme is illustrated in
350 350
300
Resistant load (kN) 250 Resistant load (kN) 250
300
200
200
150
150
100
100
50
0 50 0
0 2 4 6 8 10 0 2 4 6 8 10
Propagation period (Years) Propagation period (Years)
Failure mode Failure mode
w/c = 0.4 Concrete Bending reinforcement w/c = 0.5 Concrete Bending reinforcement
350 350
300
Resistant load (kN) 250 Resistant load (kN) 250
300
200
200
150
150
100
100
50
0 50 0
0 2 4 6 8 10 0 2 4 6 8 10
Propagation period (Years) Propagation period (Years)
Failure mode Failure mode
w/c = 0.6 Concrete Bending reinforcement w/c = 0.7 Concrete Bending reinforcement
FIGURE 5.14
Failure mode change along time. Uniform corrosion approach.