
Page 169 - Handbook of Materials Failure Analysis
P. 169
3 Experiment on Ring Specimens 165
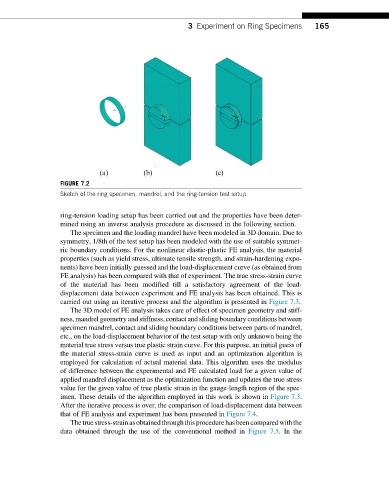
(a) (b) (c)
FIGURE 7.2
Sketch of the ring specimen, mandrel, and the ring-tension test setup.
ring-tension loading setup has been carried out and the properties have been deter-
mined using an inverse analysis procedure as discussed in the following section.
The specimen and the loading mandrel have been modeled in 3D domain. Due to
symmetry, 1/8th of the test setup has been modeled with the use of suitable symmet-
ric boundary conditions. For the nonlinear elastic-plastic FE analysis, the material
properties (such as yield stress, ultimate tensile strength, and strain-hardening expo-
nents) have been initially guessed and the load-displacement curve (as obtained from
FE analysis) has been compared with that of experiment. The true stress-strain curve
of the material has been modified till a satisfactory agreement of the load-
displacement data between experiment and FE analysis has been obtained. This is
carried out using an iterative process and the algorithm is presented in Figure 7.3.
The 3D model of FE analysis takes care of effect of specimen geometry and stiff-
ness, mandrel geometry and stiffness, contact and sliding boundary conditions between
specimen mandrel, contact and sliding boundary conditions between parts of mandrel,
etc., on the load-displacement behavior of the test setup with only unknown being the
material true stress versus true plastic strain curve. For this purpose, an initial guess of
the material stress-strain curve is used as input and an optimization algorithm is
employed for calculation of actual material data. This algorithm uses the modulus
of difference between the experimental and FE calculated load for a given value of
applied mandrel displacement as the optimization function and updates the true stress
value for the given value of true plastic strain in the gauge-length region of the spec-
imen. These details of the algorithm employed in this work is shown in Figure 7.3.
After the iterative process is over, the comparison of load-displacement data between
that of FE analysis and experiment has been presented in Figure 7.4.
Thetruestress-strainasobtainedthroughthis procedure has beencomparedwiththe
data obtained through the use of the conventional method in Figure 7.5.Inthe