
Page 258 - Handbook of Materials Failure Analysis
P. 258
254 CHAPTER 10 A reliable analysis method
H9, H10 B17, B18
H7, H8
H5, H6
H3, H4
B15, B16
H1, H2
B13, B14
B11, B12
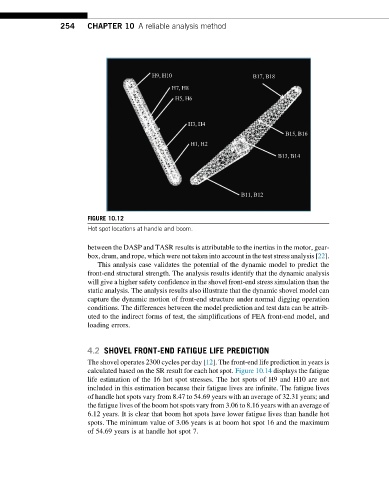
FIGURE 10.12
Hot spot locations at handle and boom.
between the DASP and TASR results is attributable to the inertias in the motor, gear-
box, drum, and rope, which were not taken into account in the test stress analysis [22].
This analysis case validates the potential of the dynamic model to predict the
front-end structural strength. The analysis results identify that the dynamic analysis
will give a higher safety confidence in the shovel front-end stress simulation than the
static analysis. The analysis results also illustrate that the dynamic shovel model can
capture the dynamic motion of front-end structure under normal digging operation
conditions. The differences between the model prediction and test data can be attrib-
uted to the indirect forms of test, the simplifications of FEA front-end model, and
loading errors.
4.2 SHOVEL FRONT-END FATIGUE LIFE PREDICTION
The shovel operates 2300 cycles per day [12]. The front-end life prediction in years is
calculated based on the SR result for each hot spot. Figure 10.14 displays the fatigue
life estimation of the 16 hot spot stresses. The hot spots of H9 and H10 are not
included in this estimation because their fatigue lives are infinite. The fatigue lives
of handle hot spots vary from 8.47 to 54.69 years with an average of 32.31 years; and
the fatigue lives of the boom hot spots vary from 3.06 to 8.16 years with an average of
6.12 years. It is clear that boom hot spots have lower fatigue lives than handle hot
spots. The minimum value of 3.06 years is at boom hot spot 16 and the maximum
of 54.69 years is at handle hot spot 7.