
Page 257 - Handbook of Materials Failure Analysis
P. 257
4 Results and Discussion 253
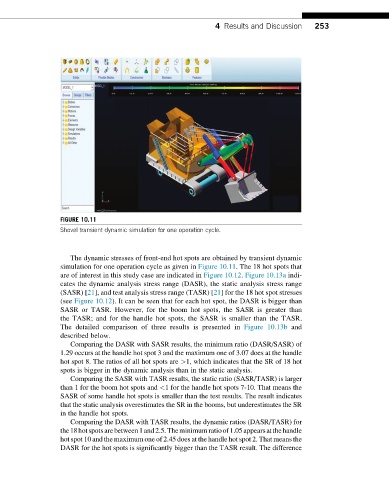
FIGURE 10.11
Shovel transient dynamic simulation for one operation cycle.
The dynamic stresses of front-end hot spots are obtained by transient dynamic
simulation for one operation cycle as given in Figure 10.11. The 18 hot spots that
are of interest in this study case are indicated in Figure 10.12. Figure 10.13a indi-
catesthedynamicanalysisstressrange (DASR), the static analysis stress range
(SASR) [21], and test analysis stress range (TASR) [21] for the 18 hot spot stresses
(see Figure 10.12). It can be seen that for each hot spot, the DASR is bigger than
SASR or TASR. However, for the boom hot spots, the SASR is greater than
the TASR; and for the handle hot spots, the SASR is smaller than the TASR.
The detailed comparison of three results is presented in Figure 10.13b and
described below.
Comparing the DASR with SASR results, the minimum ratio (DASR/SASR) of
1.29 occurs at the handle hot spot 3 and the maximum one of 3.07 does at the handle
hot spot 8. The ratios of all hot spots are >1, which indicates that the SR of 18 hot
spots is bigger in the dynamic analysis than in the static analysis.
Comparing the SASR with TASR results, the static ratio (SASR/TASR) is larger
than 1 for the boom hot spots and <1 for the handle hot spots 7-10. That means the
SASR of some handle hot spots is smaller than the test results. The result indicates
that the static analysis overestimates the SR in the booms, but underestimates the SR
in the handle hot spots.
Comparing the DASR with TASR results, the dynamic ratios (DASR/TASR) for
the18hotspotsarebetween1and2.5.Theminimumratioof1.05appearsatthehandle
hot spot 10 and the maximum one of 2.45 does at the handle hot spot 2. That means the
DASR for the hot spots is significantly bigger than the TASR result. The difference