
Page 259 - Handbook of Materials Failure Analysis
P. 259
140
120
DASR SASR TASR
100
Stress range (MPa) 80
60
40
20
0
H1 H2 H3 H4 H5 H6 H7 H8 H9 H10 B11 B12 B13 B14 B15 B16 B17 B18
(a) Hot spot
3.5
3.0 DASR/TASR
SASR/TASR
2.5
DASR/SASR
Stress ratio 1.5
2.0
1.0
0.5
0.0
H1 H2 H3 H4 H5 H6 H7 H8 H9 H10 B11 B12 B13 B14 B15 B16 B17 B18
(b) Hot spot
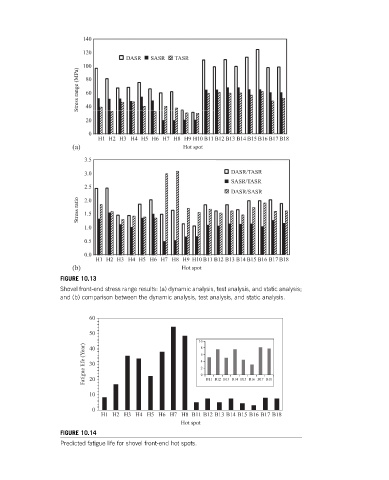
FIGURE 10.13
Shovel front-end stress range results: (a) dynamic analysis, test analysis, and static analysis;
and (b) comparison between the dynamic analysis, test analysis, and static analysis.
60
50
10 8
Fatigue life (Y ear) 30 6 4 2 0 B11 B12 B13 B14 B15 B16 B17 B18
40
20
10
0
H1 H2 H3 H4 H5 H6 H7 H8 B11 B12 B13 B14 B15 B16 B17 B18
Hot spot
FIGURE 10.14
Predicted fatigue life for shovel front-end hot spots.