
Page 91 - Handbook of Materials Failure Analysis
P. 91
2 Case History 85
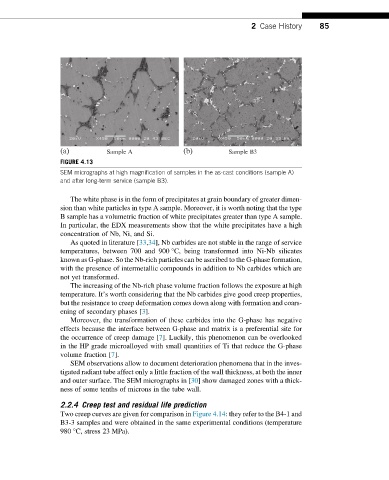
(a) Sample A (b) Sample B3
FIGURE 4.13
SEM micrographs at high magnification of samples in the as-cast conditions (sample A)
and after long-term service (sample B3).
The white phase is in the form of precipitates at grain boundary of greater dimen-
sion than white particles in type A sample. Moreover, it is worth noting that the type
B sample has a volumetric fraction of white precipitates greater than type A sample.
In particular, the EDX measurements show that the white precipitates have a high
concentration of Nb, Ni, and Si.
As quoted in literature [33,34], Nb carbides are not stable in the range of service
temperatures, between 700 and 900 °C, being transformed into Ni-Nb silicates
known as G-phase. So the Nb-rich particles can be ascribed to the G-phase formation,
with the presence of intermetallic compounds in addition to Nb carbides which are
not yet transformed.
The increasing of the Nb-rich phase volume fraction follows the exposure at high
temperature. It’s worth considering that the Nb carbides give good creep properties,
but the resistance to creep deformation comes down along with formation and coars-
ening of secondary phases [3].
Moreover, the transformation of these carbides into the G-phase has negative
effects because the interface between G-phase and matrix is a preferential site for
the occurrence of creep damage [7]. Luckily, this phenomenon can be overlooked
in the HP grade microalloyed with small quantities of Ti that reduce the G-phase
volume fraction [7].
SEM observations allow to document deterioration phenomena that in the inves-
tigated radiant tube affect only a little fraction of the wall thickness, at both the inner
and outer surface. The SEM micrographs in [30] show damaged zones with a thick-
ness of some tenths of microns in the tube wall.
2.2.4 Creep test and residual life prediction
Two creep curves are given for comparison in Figure 4.14: they refer to the B4-1 and
B3-3 samples and were obtained in the same experimental conditions (temperature
980 °C, stress 23 MPa).