
Page 93 - Handbook of Materials Failure Analysis
P. 93
2 Case History 87
Catalogue data - mean curve
100
Catalogue data - minimum curve
Sample A - as supplied
Sample B3 (deformed) - after 114000h
Sample B1 (deformed) - after 90000h
Sample B4 (undeformed) - after 114000h
Stress (MPa) Interrupted
test
10
29 30 31 32 33 34 35
LMP
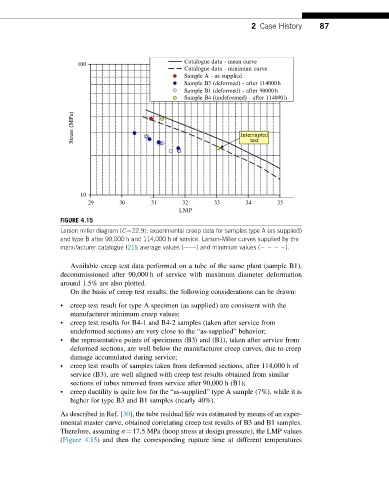
FIGURE 4.15
Larson miller diagram (C¼22.9): experimental creep data for samples type A (as supplied)
and type B after 90,000 h and 114,000 h of service. Larson-Miller curves supplied by the
manufacturer catalogue [21]: average values (––––) and minimum values ( ).
Available creep test data performed on a tube of the same plant (sample B1),
decommissioned after 90,000 h of service with maximum diameter deformation
around 1.5% are also plotted.
On the basis of creep test results, the following considerations can be drawn:
• creep test result for type A specimen (as supplied) are consistent with the
manufacturer minimum creep values;
• creep test results for B4-1 and B4-2 samples (taken after service from
undeformed sections) are very close to the “as-supplied” behavior;
• the representative points of specimens (B3) and (B1), taken after service from
deformed sections, are well below the manufacturer creep curves, due to creep
damage accumulated during service;
• creep test results of samples taken from deformed sections, after 114,000 h of
service (B3), are well aligned with creep test results obtained from similar
sections of tubes removed from service after 90,000 h (B1);
• creep ductility is quite low for the “as-supplied” type A sample (7%), while it is
higher for type B3 and B1 samples (nearly 40%).
As described in Ref. [30], the tube residual life was estimated by means of an exper-
imental master curve, obtained correlating creep test results of B3 and B1 samples.
Therefore, assuming σ ¼17.5 MPa (hoop stress at design pressure), the LMP values
(Figure 4.15) and then the corresponding rupture time at different temperatures