
Page 92 - Handbook of Materials Failure Analysis
P. 92
86 CHAPTER 4 Creep damage of high alloyed reformer tubes
30
25
20
specimen B3–3
Strain (%) 15 specimen B4–1
10
5
0
0 50 100 150 200 250 300 350 400 450
Time (h)
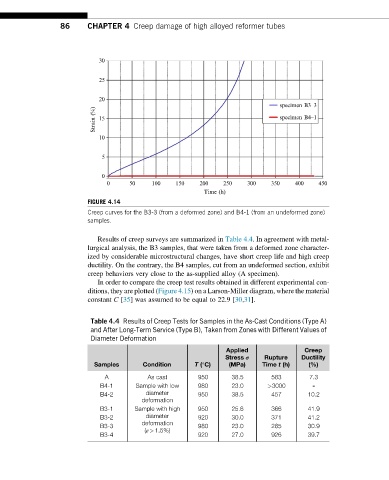
FIGURE 4.14
Creep curves for the B3-3 (from a deformed zone) and B4-1 (from an undeformed zone)
samples.
Results of creep surveys are summarized in Table 4.4. In agreement with metal-
lurgical analysis, the B3 samples, that were taken from a deformed zone character-
ized by considerable microstructural changes, have short creep life and high creep
ductility. On the contrary, the B4 samples, cut from an undeformed section, exhibit
creep behaviors very close to the as-supplied alloy (A specimen).
In order to compare the creep test results obtained in different experimental con-
ditions, they are plotted (Figure 4.15) on a Larson-Miller diagram, where the material
constant C [35] was assumed to be equal to 22.9 [30,31].
Table 4.4 Results of Creep Tests for Samples in the As-Cast Conditions (Type A)
and After Long-Term Service (Type B), Taken from Zones with Different Values of
Diameter Deformation
Applied Creep
Stress σ Rupture Ductility
Samples Condition T (°C) (MPa) Time t (h) (%)
A As cast 950 38.5 583 7.3
B4-1 Sample with low 980 23.0 >3000 -
B4-2 diameter 950 38.5 457 10.2
deformation
B3-1 Sample with high 950 25.6 366 41.9
B3-2 diameter 920 30.0 371 41.2
deformation
B3-3 980 23.0 285 30.9
(ε>1.5%)
B3-4 920 27.0 926 39.7