
Page 88 - Handbook of Materials Failure Analysis
P. 88
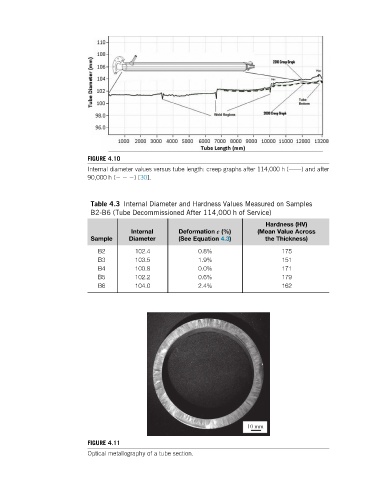
FIGURE 4.10
                         Internal diameter values versus tube length: creep graphs after 114,000 h (——) and after
                         90,000 h (    )[30].


                          Table 4.3 Internal Diameter and Hardness Values Measured on Samples
                          B2-B6 (Tube Decommissioned After 114,000 h of Service)
                                                                           Hardness (HV)
                                     Internal      Deformation ε (%)    (Mean Value Across
                          Sample     Diameter      (See Equation 4.3)     the Thickness)
                            B2        102.4             0.8%                   175
                            B3        103.5             1.9%                   151
                            B4        100.8             0.0%                   171
                            B5        102.2             0.6%                   179
                            B6        104.0             2.4%                   162


                                                                      10 mm

                         FIGURE 4.11
                         Optical metallography of a tube section.