
Page 87 - Handbook of Materials Failure Analysis
P. 87
Internal diameter growth tube map Plant north
Row1
1 5 10 15 20 25 30 35 40 44
Row2
1 5 10 15 20 25 30 35 40 44
Row3
1 5 10 15 20 25 30 35 40 44
Row4
1 5 10 15 20 25 30 35 40 44
ID Growth legend
<1.0%
=1.0% < 1.5%
=1.5% < 2.0%
=.2.0% < 3.0%
>3.0%
(a)
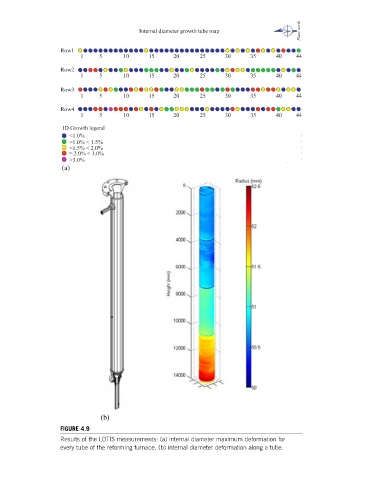
FIGURE 4.9
Results of the LOTIS measurements: (a) internal diameter maximum deformation for
every tube of the reforming furnace, (b) internal diameter deformation along a tube.