
Page 75 - Handbook of Natural Gas Transmission and Processing Principles and Practices
P. 75
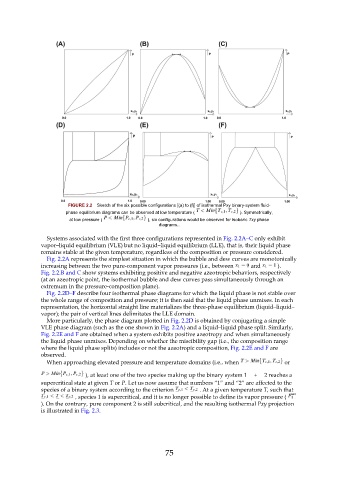
FIGURE 2.2  Sketch of the six possible configurations [(a) to (f)] of isothermal Pxy binary-system fluid-
                        phase equilibrium diagrams can be observed at low temperature (    ). Symmetrically,
                         at low pressure (           ), six configurations would be observed for isobaric Txy phase
                                                         diagrams..

                 Systems associated with the first three configurations represented in Fig. 2.2A–C only exhibit
               vapor–liquid equilibrium (VLE) but no liquid–liquid equilibrium (LLE), that is, their liquid phase
               remains stable at the given temperature, regardless of the composition or pressure considered.
                 Fig. 2.2A represents the simplest situation in which the bubble and dew curves are monotonically
               increasing between the two pure-component vapor pressures (i.e., between    and     ).
               Fig. 2.2.B and C show systems exhibiting positive and negative azeotropic behaviors, respectively
               (at an azeotropic point, the isothermal bubble and dew curves pass simultaneously through an
               extremum in the pressure-composition plane).
                 Fig. 2.2D–F describe four isothermal phase diagrams for which the liquid phase is not stable over
               the whole range of composition and pressure; it is then said that the liquid phase unmixes. In each
               representation, the horizontal straight line materializes the three-phase equilibrium (liquid–liquid–
               vapor); the pair of vertical lines delimitates the LLE domain.
                 More particularly, the phase diagram plotted in Fig. 2.2D is obtained by conjugating a simple
               VLE phase diagram (such as the one shown in Fig. 2.2A) and a liquid–liquid phase split. Similarly,
               Fig. 2.2E and F are obtained when a system exhibits positive azeotropy and when simultaneously
               the liquid phase unmixes. Depending on whether the miscibility gap (i.e., the composition range
               where the liquid phase splits) includes or not the azeotropic composition, Fig. 2.2E and F are
               observed.
                 When approaching elevated pressure and temperature domains (i.e., when              or

                                ), at least one of the two species making up the binary system 1    +    2 reaches a
               supercritical state at given T or P. Let us now assume that numbers “1” and “2” are affected to the
               species of a binary system according to the criterion    . At a given temperature T, such that
                            , species 1 is supercritical, and it is no longer possible to define its vapor pressure (
               ). On the contrary, pure component 2 is still subcritical, and the resulting isothermal Pxy projection
               is illustrated in Fig. 2.3.


                                                           75