
Page 77 - Handbook of Natural Gas Transmission and Processing Principles and Practices
P. 77
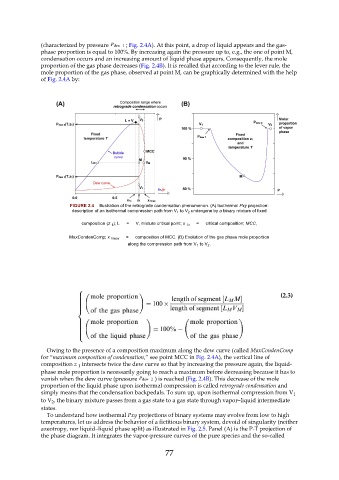
(characterized by pressure     ; Fig. 2.4A). At this point, a drop of liquid appears and the gas-
               phase proportion is equal to 100%. By increasing again the pressure up to, e.g., the one of point M,
               condensation occurs and an increasing amount of liquid phase appears. Consequently, the mole
               proportion of the gas phase decreases (Fig. 2.4B). It is recalled that according to the lever rule, the
               mole proportion of the gas phase, observed at point M, can be graphically determined with the help
               of Fig. 2.4A by:


                          FIGURE 2.4  Illustration of the retrograde condensation phenomenon. (A) Isothermal Pxy projection:
                          description of an isothermal compression path from V 1  to V 2  undergone by a binary mixture of fixed

                              composition (z  1 ); L    =    V, mixture critical point; x  1c   =    critical composition; MCC,

                         MaxCondenComp; x  1max    =    composition of MCC. (B) Evolution of the gas phase mole proportion
                                              along the compression path from V 1  to V 2 .


                                                                                                    (2.3)


                 Owing to the presence of a composition maximum along the dew curve (called MaxCondenComp
               for “maximum composition of condensation,” see point MCC in Fig. 2.4A), the vertical line of
               composition z   intersects twice the dew curve so that by increasing the pressure again, the liquid-
                            1
               phase mole proportion is necessarily going to reach a maximum before decreasing because it has to
               vanish when the dew curve (pressure      ) is reached (Fig. 2.4B). This decrease of the mole
               proportion of the liquid phase upon isothermal compression is called retrograde condensation and
               simply means that the condensation backpedals. To sum up, upon isothermal compression from V 1
               to V , the binary mixture passes from a gas state to a gas state through vapor–liquid intermediate
                   2
               states.
                 To understand how isothermal Pxy projections of binary systems may evolve from low to high
               temperatures, let us address the behavior of a fictitious binary system, devoid of singularity (neither
               azeotropy, nor liquid–liquid phase split) as illustrated in Fig. 2.5. Panel (A) is the P-T projection of
               the phase diagram. It integrates the vapor-pressure curves of the pure species and the so-called

                                                           77