
Page 81 - Handbook of Natural Gas Transmission and Processing Principles and Practices
P. 81
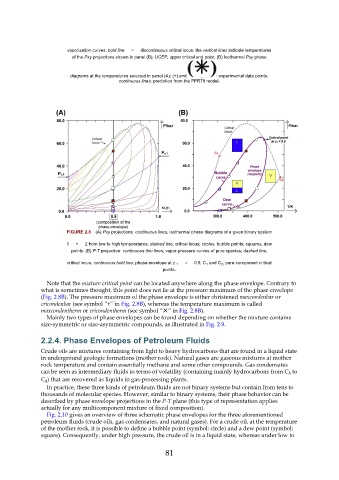
vaporization curves; bold line   =    discontinuous critical locus; the vertical lines indicate temperatures
                          of the Pxy projections shown in panel (B); UCEP, upper critical end point. (B) Isothermal Pxy phase


                          diagrams at the temperatures selected in panel (A); (+) and   : experimental data points;
                                           continuous lines: prediction from the PPR78 model.


                        FIGURE 2.8  (A) Pxy projections: continuous lines, isothermal phase diagrams of a given binary system

                        1    +    2 from low to high temperatures; dashed line, critical locus; circles, bubble points; squares, dew
                          points. (B) P-T projection: continuous thin lines, vapor-pressure curves of pure species; dashed line,
                         critical locus; continuous bold line, phase envelope at z  1    =    0.5; C 1  and C 2 , pure-component critical
                                                          points.

                 Note that the mixture critical point can be located anywhere along the phase envelope. Contrary to
               what is sometimes thought, this point does not lie at the pressure maximum of the phase envelope
               (Fig. 2.8B). The pressure maximum of the phase envelope is either christened maxcondenbar or
               cricondenbar (see symbol “+” in Fig. 2.8B), whereas the temperature maximum is called
               maxcondentherm or cricondentherm (see symbol “✕” in Fig. 2.8B).
                 Mainly two types of phase envelopes can be found depending on whether the mixture contains
               size-symmetric or size-asymmetric compounds, as illustrated in Fig. 2.9.


               2.2.4. Phase Envelopes of Petroleum Fluids
               Crude oils are mixtures containing from light to heavy hydrocarbons that are found in a liquid state
               in underground geologic formations (mother rock). Natural gases are gaseous mixtures at mother
               rock temperature and contain essentially methane and some other compounds. Gas condensates
               can be seen as intermediary fluids in terms of volatility (containing mainly hydrocarbons from C  to
                                                                                                      5
               C ) that are recovered as liquids in gas-processing plants.
                 8
                 In practice, these three kinds of petroleum fluids are not binary systems but contain from tens to
               thousands of molecular species. However, similar to binary systems, their phase behavior can be
               described by phase envelope projections in the P-T plane (this type of representation applies
               actually for any multicomponent mixture of fixed composition).
                 Fig. 2.10 gives an overview of three schematic phase envelopes for the three aforementioned
               petroleum fluids (crude oils, gas condensates, and natural gases). For a crude oil, at the temperature
               of the mother rock, it is possible to define a bubble point (symbol: circle) and a dew point (symbol:
               square). Consequently, under high pressure, the crude oil is in a liquid state, whereas under low to

                                                           81