
Page 78 - Handbook of Natural Gas Transmission and Processing Principles and Practices
P. 78
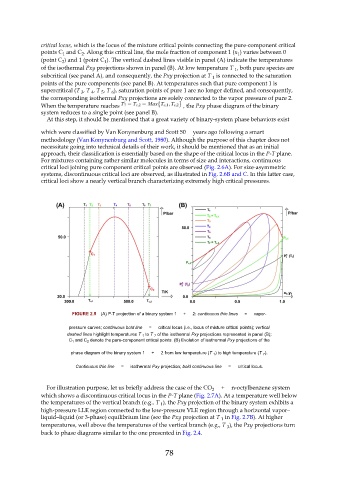
critical locus, which is the locus of the mixture critical points connecting the pure-component critical
               points C  and C . Along this critical line, the mole fraction of component 1 (x ) varies between 0
                              2
                       1
                                                                                    1
               (point C ) and 1 (point C ). The vertical dashed lines visible in panel (A) indicate the temperatures
                       2
                                      1
               of the isothermal Pxy projections shown in panel (B). At low temperature T  , both pure species are
                                                                                   1
               subcritical (see panel A), and consequently, the Pxy projection at T   is connected to the saturation
                                                                            1
               points of the pure components (see panel B). At temperatures such that pure component 1 is
               supercritical (T  , T  , T  , T  ), saturation points of pure 1 are no longer defined, and consequently,
                                        6
                              3
                                 4
                                     5
               the corresponding isothermal Pxy projections are solely connected to the vapor pressure of pure 2.
               When the temperature reaches                       , the Pxy phase diagram of the binary
               system reduces to a single point (see panel B).
                 At this step, it should be mentioned that a great variety of binary-system phase behaviors exist
               which were classified by Van Konynenburg and Scott 50    years ago following a smart
               methodology (Van Konynenburg and Scott, 1980). Although the purpose of this chapter does not
               necessitate going into technical details of their work, it should be mentioned that as an initial
               approach, their classification is essentially based on the shape of the critical locus in the P-T plane.
               For mixtures containing rather similar molecules in terms of size and interactions, continuous
               critical loci joining pure component critical points are observed (Fig. 2.6A). For size-asymmetric
               systems, discontinuous critical loci are observed, as illustrated in Fig. 2.6B and C. In this latter case,
               critical loci show a nearly vertical branch characterizing extremely high critical pressures.


                          FIGURE 2.5  (A) P-T projection of a binary system 1    +    2: continuous thin lines   =    vapor-

                         pressure curves; continuous bold line   =    critical locus (i.e., locus of mixture critical points); vertical
                         dashed lines highlight temperatures T  1  to T  7  of the isothermal Pxy projections represented in panel (B);
                         C 1  and C 2  denote the pure-component critical points. (B) Evolution of isothermal Pxy projections of the

                          phase diagram of the binary system 1    +    2 from low temperature (T  1 ) to high temperature (T  7 ).

                            Continuous thin line   =    isothermal Pxy projection; bold continuous line   =    critical locus.


                 For illustration purpose, let us briefly address the case of the CO    +    n-octylbenzene system
                                                                           2
               which shows a discontinuous critical locus in the P-T plane (Fig. 2.7A). At a temperature well below
               the temperatures of the vertical branch (e.g., T  ), the Pxy projection of the binary system exhibits a
                                                         1
               high-pressure LLE region connected to the low-pressure VLE region through a horizontal vapor–
               liquid–liquid (or 3-phase) equilibrium line (see the Pxy projection at T   in Fig. 2.7B). At higher
                                                                               1
               temperatures, well above the temperatures of the vertical branch (e.g., T  ), the Pxy projections turn
                                                                                 3
               back to phase diagrams similar to the one presented in Fig. 2.4.

                                                           78