
Page 80 - Handbook of Natural Gas Transmission and Processing Principles and Practices
P. 80
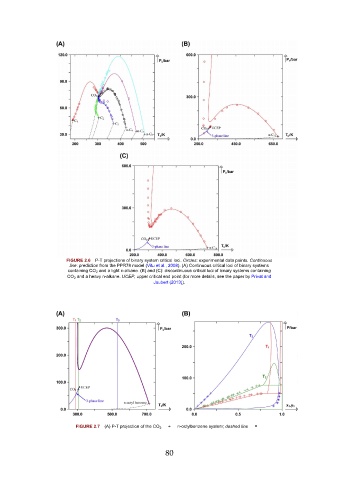
FIGURE 2.6  P-T projections of binary system critical loci. Circles: experimental data points. Continuous
                         line: prediction from the PPR78 model (Vitu et al., 2008). (A) Continuous critical loci of binary systems
                         containing CO 2  and a light n-alkane. (B) and (C): discontinuous critical loci of binary systems containing
                         CO 2  and a heavy n-alkane. UCEP, upper critical end point (for more details, see the paper by Privat and
                                                       Jaubert (2013)).


                            FIGURE 2.7  (A) P-T projection of the CO 2    +    n-octylbenzene system; dashed line   =


                                                           80