
Page 47 - Handbook of Properties of Textile and Technical Fibres
P. 47
28 Handbook of Properties of Textile and Technical Fibres
(a) (b) (c)
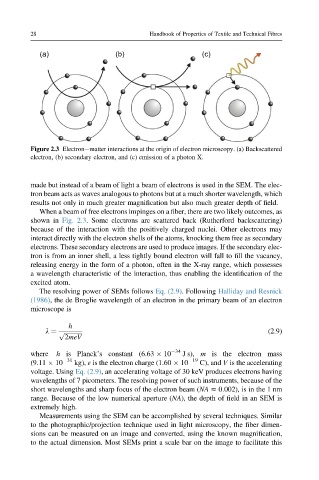
Figure 2.3 Electronematter interactions at the origin of electron microscopy. (a) Backscattered
electron, (b) secondary electron, and (c) emission of a photon X.
made but instead of a beam of light a beam of electrons is used in the SEM. The elec-
tron beam acts as waves analogous to photons but at a much shorter wavelength, which
results not only in much greater magnification but also much greater depth of field.
When a beam of free electrons impinges on a fiber, there are two likely outcomes, as
shown in Fig. 2.3. Some electrons are scattered back (Rutherford backscattering)
because of the interaction with the positively charged nuclei. Other electrons may
interact directly with the electron shells of the atoms, knocking them free as secondary
electrons. These secondary electrons are used to produce images. If the secondary elec-
tron is from an inner shell, a less tightly bound electron will fall to fill the vacancy,
releasing energy in the form of a photon, often in the X-ray range, which possesses
a wavelength characteristic of the interaction, thus enabling the identification of the
excited atom.
The resolving power of SEMs follows Eq. (2.9). Following Halliday and Resnick
(1986), the de Broglie wavelength of an electron in the primary beam of an electron
microscope is
h
l ¼ p ffiffiffiffiffiffiffiffiffiffiffiffi (2.9)
2meV
where h is Planck’s constant (6.63 10 34 J s), m is the electron mass
(9.11 10 31 kg), e is the electron charge (1.60 10 19 C), and V is the accelerating
voltage. Using Eq. (2.9), an accelerating voltage of 30 keV produces electrons having
wavelengths of 7 picometers. The resolving power of such instruments, because of the
short wavelengths and sharp focus of the electron beam (NA z 0:002), is in the 1 nm
range. Because of the low numerical aperture (NA), the depth of field in an SEM is
extremely high.
Measurements using the SEM can be accomplished by several techniques. Similar
to the photographic/projection technique used in light microscopy, the fiber dimen-
sions can be measured on an image and converted, using the known magnification,
to the actual dimension. Most SEMs print a scale bar on the image to facilitate this