
Page 52 - Handbook of Properties of Textile and Technical Fibres
P. 52
Testing and characterization of fibers 33
50 100
50
50
100
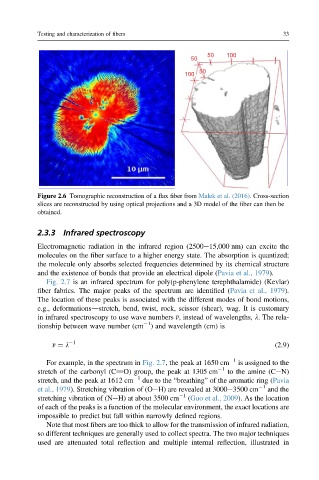
Figure 2.6 Tomographic reconstruction of a flax fiber from Malek et al. (2016). Cross-section
slices are reconstructed by using optical projections and a 3D model of the fiber can then be
obtained.
2.3.3 Infrared spectroscopy
Electromagnetic radiation in the infrared region (2500e15,000 nm) can excite the
molecules on the fiber surface to a higher energy state. The absorption is quantized;
the molecule only absorbs selected frequencies determined by its chemical structure
and the existence of bonds that provide an electrical dipole (Pavia et al., 1979).
Fig. 2.7 is an infrared spectrum for poly(p-phenylene terephthalamide) (Kevlar)
fiber fabrics. The major peaks of the spectrum are identified (Pavia et al., 1979).
The location of these peaks is associated with the different modes of bond motions,
e.g., deformationsdstretch, bend, twist, rock, scissor (shear), wag. It is customary
in infrared spectroscopy to use wave numbers n, instead of wavelengths, l. The rela-
1
tionship between wave number (cm ) and wavelength (cm) is
n ¼ l 1 (2.9)
For example, in the spectrum in Fig. 2.7, the peak at 1650 cm 1 is assigned to the
stretch of the carbonyl (C]O) group, the peak at 1305 cm 1 to the amine (CeN)
stretch, and the peak at 1612 cm 1 due to the “breathing” of the aromatic ring (Pavia
et al., 1979). Stretching vibration of (OeH) are revealed at 3000e3500 cm 1 and the
stretching vibration of (NeH) at about 3500 cm 1 (Guo et al., 2009). As the location
of each of the peaks is a function of the molecular environment, the exact locations are
impossible to predict but fall within narrowly defined regions.
Note that most fibers are too thick to allow for the transmission of infrared radiation,
so different techniques are generally used to collect spectra. The two major techniques
used are attenuated total reflection and multiple internal reflection, illustrated in