
Page 55 - Handbook of Properties of Textile and Technical Fibres
P. 55
36 Handbook of Properties of Textile and Technical Fibres
(a) (b)
100
955 1130
1635
1048 1235 1445
Intensity Intensity 515 595 1300
1060
1048
900 1390
335 1340 1545
465 705 795
640
–400 –200 0 200 400 0 200 400 600 800 1000 1200 1400 1600
Wavenumber/cm –1 Wavenumber/cm –1
Figure 2.9 Polarized Raman spectra of PA66 parallel and perpendicular to the fiber axis from
Marcellan et al. (2004). (a) Low wave number range (collective or squeletal motions). (b)
Stokes Raman scattering in the 100e1800 cm 1 range.
A comparison of Raman scattering obtained from fibers drawn to different extents
shows clearly the rise of peaks at certain frequencies which can therefore be associated
with crystalline or amorphous regions and in some cases, such as PET, the transforma-
tion of gauche to transmolecular conformations, aiding crystallinity (Colomban et al.,
2006).
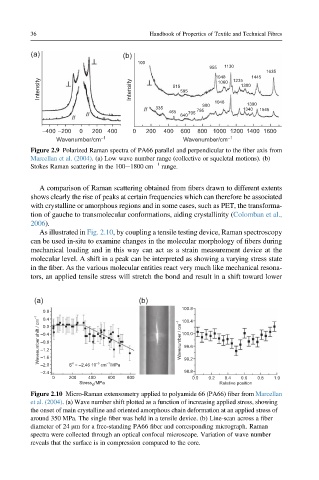
As illustrated in Fig. 2.10, by coupling a tensile testing device, Raman spectroscopy
can be used in-situ to examine changes in the molecular morphology of fibers during
mechanical loading and in this way can act as a strain measurement device at the
molecular level. A shift in a peak can be interpreted as showing a varying stress state
in the fiber. As the various molecular entities react very much like mechanical resona-
tors, an applied tensile stress will stretch the bond and result in a shift toward lower
(a) (b)
100.8
0.8 100.4
Wavenumber shift / cm –1 –0.4 Wavenumber / cm –1 100.0
0.4
0.0
–0.8
99.6
–1.2
–1.6
σ
–1
–3
–2.0 S = –2.46 10 cm /MPa 99.2
–2.4 98.8
0 200 400 600 800 0.0 0.2 0.4 0.6 0.8 1.0
/MPa
Stress t0 Relative position
Figure 2.10 Micro-Raman extensometry applied to polyamide 66 (PA66) fiber from Marcellan
et al. (2004). (a) Wave number shift plotted as a function of increasing applied stress, showing
the onset of main crystalline and oriented amorphous chain deformation at an applied stress of
around 350 MPa. The single fiber was held in a tensile device. (b) Line-scan across a fiber
diameter of 24 mm for a free-standing PA66 fiber and corresponding micrograph. Raman
spectra were collected through an optical confocal microscope. Variation of wave number
reveals that the surface is in compression compared to the core.