
Page 297 - Handbook of Structural Steel Connection Design and Details
P. 297
Partially Restrained Connections
282 Chapter Four
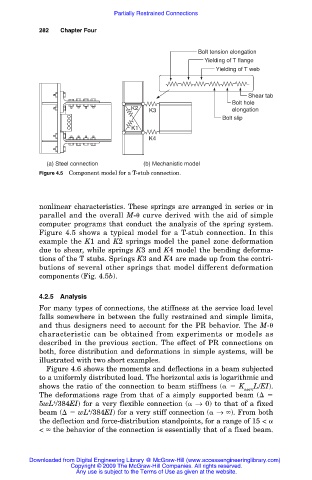
Bolt tension elongation
Yielding of T flange
Yielding of T web
Shear tab
Bolt hole
K2 K3 elongation
Bolt slip
K1
K4
(a) Steel connection (b) Mechanistic model
Figure 4.5 Component model for a T-stub connection.
nonlinear characteristics. These springs are arranged in series or in
parallel and the overall M- curve derived with the aid of simple
computer programs that conduct the analysis of the spring system.
Figure 4.5 shows a typical model for a T-stub connection. In this
example the K1 and K2 springs model the panel zone deformation
due to shear, while springs K3 and K4 model the bending deforma-
tions of the T stubs. Springs K3 and K4 are made up from the contri-
butions of several other springs that model different deformation
components (Fig. 4.5b).
4.2.5 Analysis
For many types of connections, the stiffness at the service load level
falls somewhere in between the fully restrained and simple limits,
and thus designers need to account for the PR behavior. The M-
characteristic can be obtained from experiments or models as
described in the previous section. The effect of PR connections on
both, force distribution and deformations in simple systems, will be
illustrated with two short examples.
Figure 4.6 shows the moments and deflections in a beam subjected
to a uniformly distributed load. The horizontal axis is logarithmic and
shows the ratio of the connection to beam stiffness ( K L/EI).
serv
The deformations rage from that of a simply supported beam (
5wL /384EI) for a very flexible connection ( → 0) to that of a fixed
4
beam ( wL /384EI) for a very stiff connection ( → ). From both
4
the deflection and force-distribution standpoints, for a range of 15 <
< the behavior of the connection is essentially that of a fixed beam.
Downloaded from Digital Engineering Library @ McGraw-Hill (www.accessengineeringlibrary.com)
Copyright © 2009 The McGraw-Hill Companies. All rights reserved.
Any use is subject to the Terms of Use as given at the website.