
Page 147 - High Power Laser Handbook
P. 147
116 Diode Lasers Semiconductor Laser Diodes 117
3.0
6.0 mm
7.5 mm
2.5
2.0
P (W) 1.5
1.0
0.5
0.0
0.0 0.5 1.0 1.5 2.0 2.5 3.0 3.5 4.0
I (A)
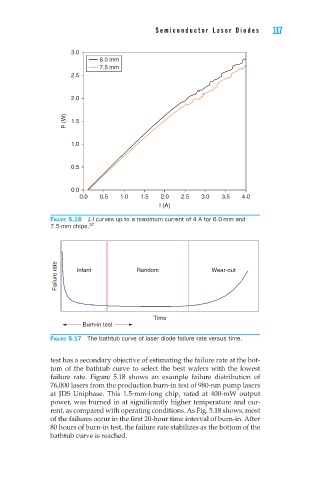
Figure 5.16 L-I curves up to a maximum current of 4 A for 6.0-mm and
7.5-mm chips. 37
Failure rate Infant Random Wear-out
Time
Burn-in test
Figure 5.17 The bathtub curve of laser diode failure rate versus time.
test has a secondary objective of estimating the failure rate at the bot-
tom of the bathtub curve to select the best wafers with the lowest
failure rate. Figure 5.18 shows an example failure distribution of
76,000 lasers from the production burn-in test of 980-nm pump lasers
at JDS Uniphase. This 1.5-mm-long chip, rated at 400-mW output
power, was burned in at significantly higher temperature and cur-
rent, as compared with operating conditions. As Fig. 5.18 shows, most
of the failures occur in the first 20-hour time interval of burn-in. After
80 hours of burn-in test, the failure rate stabilizes as the bottom of the
bathtub curve is reached.