
Page 148 - High Power Laser Handbook
P. 148
118 Diode Lasers
5.35%
1.0%
0.9%
0.8%
0.7%
Failure percent 0.6%
0.5%
0.4%
0.3%
0.2% 0.18%
0.13%
0.09%
0.1% 0.08% 0.07% 0.08% 0.08%
0.0%
0–20 20–40 40–60 60–80 80–100 100–120 120–140 140–160
Time interval (hr)
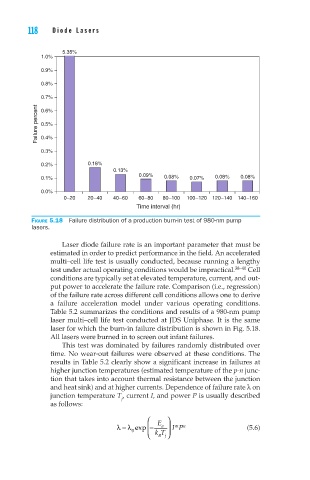
Figure 5.18 Failure distribution of a production burn-in test of 980-nm pump
lasers.
Laser diode failure rate is an important parameter that must be
estimated in order to predict performance in the field. An accelerated
multi–cell life test is usually conducted, because running a lengthy
test under actual operating conditions would be impractical. 38–40 Cell
conditions are typically set at elevated temperature, current, and out-
put power to accelerate the failure rate. Comparison (i.e., regression)
of the failure rate across different cell conditions allows one to derive
a failure acceleration model under various operating conditions.
Table 5.2 summarizes the conditions and results of a 980-nm pump
laser multi–cell life test conducted at JDS Uniphase. It is the same
laser for which the burn-in failure distribution is shown in Fig. 5.18.
All lasers were burned in to screen out infant failures.
This test was dominated by failures randomly distributed over
time. No wear-out failures were observed at these conditions. The
results in Table 5.2 clearly show a significant increase in failures at
higher junction temperatures (estimated temperature of the p-n junc-
tion that takes into account thermal resistance between the junction
and heat sink) and at higher currents. Dependence of failure rate λ on
junction temperature T , current I, and power P is usually described
j
as follows:
E
n
m
λ λ = exp − a IP (5.6)
0 kT
Bj
119