Page 317 - High Power Laser Handbook
P. 317

286     So l i d - S t at e   La s e r s                                                                                         Heat-Capacity Lasers      287


                      1
                       NODAL SOLUTION                                AUG 19 2005
                       TIME=5                                    MN     11:27:11
                       SXY     (AVG)
                       RSYS=0
                       DMX =.008275
                       SMN =–.171E+09
                       SMX =.153E+09


                                                Y
                                                  X
                                                  Z


                                   MX

                           –.600E+08  –.359E+08  –.119E+08  .122E+08  .362E+08
                                –.480E+08  –.239E+08  156250   .242E+08   .500E+08
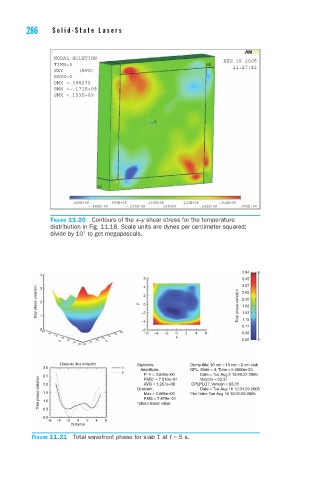
                      Figure 11.20  Contours of the x–y shear stress for the temperature
                      distribution in Fig. 11.18. Scale units are dynes per centimeter squared;
                      divide by 10  to get megapascals.
                               7


                                                                           3.84
                   4
                                                6 4                        3.45
                                                                           3.07
                  Total phase variation  2    y  2 0                      Total phase variation  2.69
                   3
                                                                           2.30
                                                                           1.92
                                               −2
                   1
                                                                           1.15
                                               −4                          1.53
                                                                           0.77
                   0                           −6
                    6                     6             0  2  4  6         0.38
                      4                 4       −6  −4  −2
                        2             2
                         0           0                  x
                         y  −2     −2  x                                   0.00
                            −4  −6  −6  −4
                         Lineouts thru midpoint  Statistics:  Dump title: 10 cm × 10 cm × 2 cm slab
                    3.0                   x      Amplitude:  OPL: State = 9; Time = 5.0000e+00;
                                          y         P−V = 3.836e+00           Date = Tue Aug 2 13:46:22 2005;
                    2.5
                   Total phase variation  2.0        AVG = 1.267e+00   OPLPLOT: Version = 03.01
                                                                     Version = 03.31
                                                    RMS* = 7.510e−01
                                                                     Date = Tue Aug 16 12:31:29 2005
                                              Gradient:
                    1.5
                                                            Plot Date: Tue Aug 16 12:31:29 2005
                                                    Max = 2.099e+00
                                                    RMS = 7.479e−01
                    1.0
                                              *about mean value
                    0.5
                    0.0
                     −6  −4  −2  0  2  4  6
                            Distance
                 Figure 11.21  Total wavefront phase for slab 1 at t = 5 s.
   312   313   314   315   316   317   318   319   320   321   322