
Page 316 - High Power Laser Handbook
P. 316
284 So l i d - S t at e La s e r s Heat-Capacity Lasers 285
80
C-Nd: YAG
Measured
Vertical midplane
70 Calculated slab surface
60 t = 5 s
Temperature rise (°C) 50
40
30
20
t = 1 s
10
0
−6 −4 −2 0 2 4 6
Horizontal position (cm)
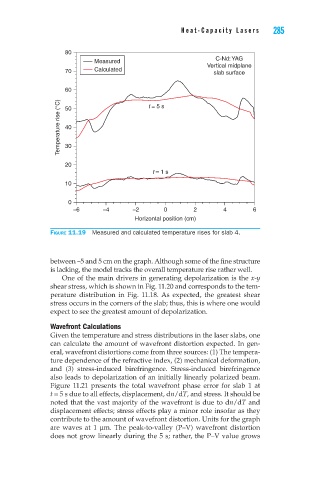
Figure 11.19 Measured and calculated temperature rises for slab 4.
between –5 and 5 cm on the graph. Although some of the fine structure
is lacking, the model tracks the overall temperature rise rather well.
One of the main drivers in generating depolarization is the x-y
shear stress, which is shown in Fig. 11.20 and corresponds to the tem-
perature distribution in Fig. 11.18. As expected, the greatest shear
stress occurs in the corners of the slab; thus, this is where one would
expect to see the greatest amount of depolarization.
Wavefront Calculations
Given the temperature and stress distributions in the laser slabs, one
can calculate the amount of wavefront distortion expected. In gen-
eral, wavefront distortions come from three sources: (1) The tempera-
ture dependence of the refractive index, (2) mechanical deformation,
and (3) stress-induced birefringence. Stress-induced birefringence
also leads to depolarization of an initially linearly polarized beam.
Figure 11.21 presents the total wavefront phase error for slab 1 at
t = 5 s due to all effects, displacement, dn/dT, and stress. It should be
noted that the vast majority of the wavefront is due to dn/dT and
displacement effects; stress effects play a minor role insofar as they
contribute to the amount of wavefront distortion. Units for the graph
are waves at 1 mm. The peak-to-valley (P–V) wavefront distortion
does not grow linearly during the 5 s; rather, the P–V value grows