
Page 315 - High Power Laser Handbook
P. 315
284 So l i d - S t at e La s e r s Heat-Capacity Lasers 285
very thin dimension, this region is not visible in the figure. Also mod-
eled is a small air gap between two adjacent pieces of edge cladding.
Again, because of the thin dimension of the air gap, this region is not
visible in the figure.
Temperature and Stress Calculations
The thermoelastic calculation begins with the specification of the
thermal source function. To this end, for the YAG region, the actual
measured laser diode array intensity profiles at the plane of the slab
were used. For the edge cladding region, it was assumed that the
unextracted energy was deposited uniformly around the active
region’s perimeter. The calculation was run for each slab in the laser
individually, because the diode array profiles were different for each
slab. For both the YAG and the GGG, the temperature dependence of
the thermal constants (notably, thermal conductivity and specific
heat) was taken into account. Time dependence was included for
both the temperature and stress parts of the calculations.
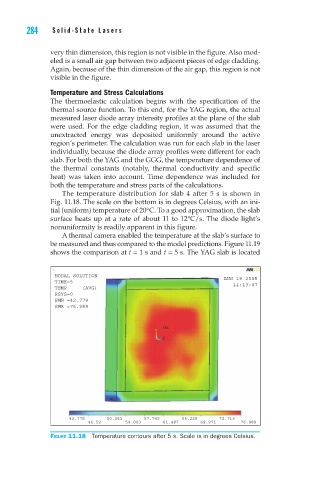
The temperature distribution for slab 4 after 5 s is shown in
Fig. 11.18. The scale on the bottom is in degrees Celsius, with an ini-
tial (uniform) temperature of 20°C. To a good approximation, the slab
surface heats up at a rate of about 11 to 12°C/s. The diode light’s
nonuniformity is readily apparent in this figure.
A thermal camera enabled the temperature at the slab’s surface to
be measured and thus compared to the model predictions. Figure 11.19
shows the comparison at t = 1 s and t = 5 s. The YAG slab is located
1
MODAL SOLUTION AUG 19 2005
TIME=5 11:13:07
TEMP (AVG)
RSYS=0
SMN =42.778
SMX =76.989
MX
Y
Z X
MN
42.778 50.261 57.745 65.229 72.713
46.52 54.003 61.487 68.971 76.989
Figure 11.18 Temperature contours after 5 s. Scale is in degrees Celsius.