
Page 319 - High Power Laser Handbook
P. 319
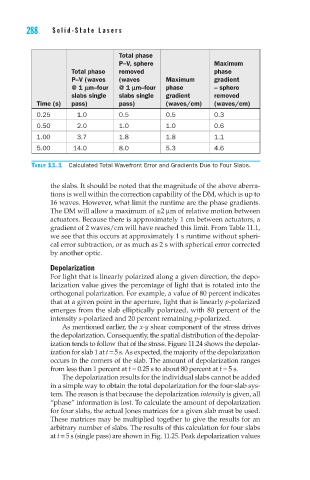
288     So l i d - S t at e   La s e r s                                                                                         Heat-Capacity Lasers      289


                                         Total phase
                                         P–V, sphere               Maximum
                            Total phase   removed                  phase
                            P–V (waves    (waves      Maximum      gradient
                            @ 1 lm–four   @ 1 lm–four   phase      – sphere
                            slabs single   slabs single   gradient   removed
                  Time (s)  pass)        pass)        (waves/cm)   (waves/cm)
                  0.25       1.0         0.5          0.5          0.3
                  0.50       2.0         1.0          1.0          0.6
                  1.00       3.7         1.8          1.8          1.1
                  5.00      14.0         8.0          5.3          4.6

                 Table 11.1  Calculated Total Wavefront Error and Gradients Due to Four Slabs.


                      the slabs. It should be noted that the magnitude of the above aberra-
                      tions is well within the correction capability of the DM, which is up to
                      16 waves. However, what limit the runtime are the phase gradients.
                      The DM will allow a maximum of ±2 mm of relative motion between
                      actuators. Because there is approximately 1 cm between actuators, a
                      gradient of 2 waves/cm will have reached this limit. From Table 11.1,
                      we see that this occurs at approximately 1 s runtime without spheri-
                      cal error subtraction, or as much as 2 s with spherical error corrected
                      by another optic.

                      Depolarization
                      For light that is linearly polarized along a given direction, the depo-
                      larization value gives the percentage of light that is rotated into the
                      orthogonal polarization. For example, a value of 80 percent indicates
                      that at a given point in the aperture, light that is linearly p-polarized
                      emerges from the slab elliptically polarized, with 80 percent of the
                      intensity s-polarized and 20 percent remaining p-polarized.
                         As mentioned earlier, the x-y shear component of the stress drives
                      the depolarization. Consequently, the spatial distribution of the depolar-
                      ization tends to follow that of the stress. Figure 11.24 shows the depolar-
                      ization for slab 1 at t = 5 s. As expected, the majority of the depolarization
                      occurs in the corners of the slab. The amount of depolarization ranges
                      from less than 1 percent at t = 0.25 s to about 80 percent at t = 5 s.
                         The depolarization results for the individual slabs cannot be added
                      in a simple way to obtain the total depolarization for the four-slab sys-
                      tem. The reason is that because the depolarization intensity is given, all
                      “phase” information is lost. To calculate the amount of depolarization
                      for four slabs, the actual Jones matrices for a given slab must be used.
                      These matrices may be multiplied together to give the results for an
                      arbitrary number of slabs. The results of this calculation for four slabs
                      at t = 5 s (single pass) are shown in Fig. 11.25. Peak depolarization values