
Page 421 - High Power Laser Handbook
P. 421
388 So l i d - S t at e La s e r s The National Ignition Facility Laser 389
2.0 × 10 15 8.1 × 10 14
1 MJ 1.8 MJ
1.6 × 10 15 500 6.4 × 10 14 500
Measured intensity (W/cm 2 ) 1.2 × 10 15 mm 0 4.8 × 10 14 mm 0
14
14
8.0 × 10
3.2 × 10
4.0 × 10 14 −500 1.6 × 10 14 −500
−1.4 × 10 12 −500 0 500 −3.2 × 10 11 −500 0 500
mm mm
2.26 × 10 15 7.60 × 10 14
1.81 × 10 15 500 6.08 × 10 14 500
Calculated intensity (W/cm 2 ) 1.36 × 10 15 mm 0 4.56 × 10 14 mm 0
14
14
3.04 × 10
9.05 × 10
4.53 × 10 14 −500 1.52 × 10 14 −500
1.30 × 10 8 −500 0 500 5.04 × 10 8 −500 0 500
mm mm
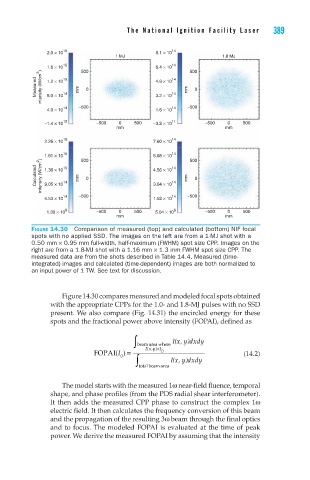
Figure 14.30 Comparison of measured (top) and calculated (bottom) NIF focal
spots with no applied SSD. The images on the left are from a 1-MJ shot with a
0.50 mm × 0.95 mm full-width, half-maximum (FWHM) spot size CPP. Images on the
right are from a 1.8-MJ shot with a 1.16 mm × 1.3 mm FWHM spot size CPP. The
measured data are from the shots described in Table 14.4. Measured (time-
integrated) images and calculated (time-dependent) images are both normalized to
an input power of 1 TW. See text for discussion.
Figure 14.30 compares measured and modeled focal spots obtained
with the appropriate CPPs for the 1.0- and 1.8-MJ pulses with no SSD
present. We also compare (Fig. 14.31) the encircled energy for these
spots and the fractional power above intensity (FOPAI), defined as
∫ beam area where I(x,y)dxdy
(, )<I
FOPAI( ) = ∫ Ix y I 0 I(x,y)dxdy (14.2)
I
0
totalbeamarea
The model starts with the measured 1ω near-field fluence, temporal
shape, and phase profiles (from the PDS radial shear interferometer).
It then adds the measured CPP phase to construct the complex 1ω
electric field. It then calculates the frequency conversion of this beam
and the propagation of the resulting 3ω beam through the final optics
and to focus. The modeled FOPAI is evaluated at the time of peak
power. We derive the measured FOPAI by assuming that the intensity