
Page 425 - High Power Laser Handbook
P. 425
392 So l i d - S t at e La s e r s The National Ignition Facility Laser 393
1.000
Fractional power above intensity 0.100 1.8 MJ 1.0 MJ
0.010
0.001
0 1.0 2.0 3.0 4.0 5.0 6.0
2
14
Intensity (10 W/cm )
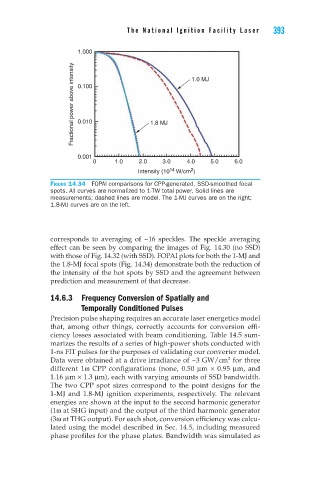
Figure 14.34 FOPAI comparisons for CPP-generated, SSD-smoothed focal
spots. All curves are normalized to 1-TW total power. Solid lines are
measurements; dashed lines are model. The 1-MJ curves are on the right;
1.8-MJ curves are on the left.
corresponds to averaging of ~16 speckles. The speckle averaging
effect can be seen by comparing the images of Fig. 14.30 (no SSD)
with those of Fig. 14.32 (with SSD). FOPAI plots for both the 1-MJ and
the 1.8-MJ focal spots (Fig. 14.34) demonstrate both the reduction of
the intensity of the hot spots by SSD and the agreement between
prediction and measurement of that decrease.
14.6.3 Frequency Conversion of Spatially and
Temporally Conditioned Pulses
Precision pulse shaping requires an accurate laser energetics model
that, among other things, correctly accounts for conversion effi-
ciency losses associated with beam conditioning. Table 14.5 sum-
marizes the results of a series of high-power shots conducted with
1-ns FIT pulses for the purposes of validating our converter model.
2
Data were obtained at a drive irradiance of ~3 GW/cm for three
different 1ω CPP configurations (none, 0.50 μm × 0.95 μm, and
1.16 μm × 1.3 μm), each with varying amounts of SSD bandwidth.
The two CPP spot sizes correspond to the point designs for the
1-MJ and 1.8-MJ ignition experiments, respectively. The relevant
energies are shown at the input to the second harmonic generator
(1ω at SHG input) and the output of the third harmonic generator
(3ω at THG output). For each shot, conversion efficiency was calcu-
lated using the model described in Sec. 14.5, including measured
phase profiles for the phase plates. Bandwidth was simulated as