
Page 424 - High Power Laser Handbook
P. 424
392 So l i d - S t at e La s e r s The National Ignition Facility Laser 393
5.20 × 10 14 2.09 × 10 14
1 MJ 1.8 MJ
4.16 × 10 14 500 1.67 × 10 14 500
Measured intensity (W/cm 2 ) 3.11 × 10 14 µm 0 1.25 × 10 14 µm 0
14
13
2.07 × 10
8.32 × 10
1.03 × 10 14 −500 4.14 × 10 13 −500
11 11
−6.79 × 10 −500 0 500 −4.29 × 10 −500 0 500
µm µm
5 × 10 14 2.18 × 10 14
4 × 10 14 500 1.75 × 10 14 500
Modeled intensity (W/cm 2 ) 3 × 10 14 µm 0 1.31 × 10 14 µm 0
13
14
8.73 × 10
2 × 10
1 × 10 14 −500 4.37 × 10 13 −500
2 × 10 10 −500 0 500 1.75 × 10 10 −500 0 500
µm µm
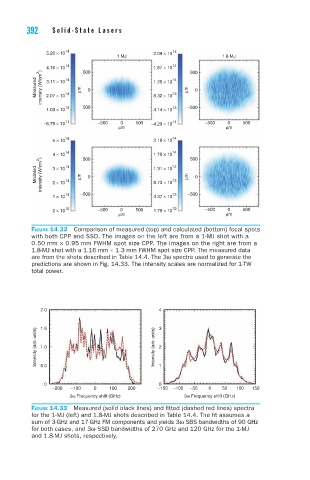
Figure 14.32 Comparison of measured (top) and calculated (bottom) focal spots
with both CPP and SSD. The images on the left are from a 1-MJ shot with a
0.50 mm × 0.95 mm FWHM spot size CPP. The images on the right are from a
1.8-MJ shot with a 1.16 mm × 1.3 mm FWHM spot size CPP. The measured data
are from the shots described in Table 14.4. The 3ω spectra used to generate the
predictions are shown in Fig. 14.33. The intensity scales are normalized for 1-TW
total power.
2.0 4
Intensity (arb. units) 1.5 Intensity (arb. units) 3 2 1
1.0
5.0
0 0
−200 −100 0 100 200 −150 −100 −50 0 50 100 150
3ω Frequency shift (GHz) 3ω Frequency shift (GHz)
Figure 14.33 Measured (solid black lines) and fitted (dashed red lines) spectra
for the 1-MJ (left) and 1.8-MJ shots described in Table 14.4. The fit assumes a
sum of 3-GHz and 17-GHz FM components and yields 3ω SBS bandwidths of 90 GHz
for both cases, and 3ω SSD bandwidths of 270 GHz and 120 GHz for the 1-MJ
and 1.8-MJ shots, respectively.