
Page 245 - How To Implement Lean Manufacturing
P. 245
The Story of the Bravo Line 223
• Create flow, including
• Establishing jidoka
• Working to destroy batches
• Establish a pull demand system
Synchronizing Supply to the Customer, Externally
The Takt Calculation
Demand was 10,000 units per week and the normal workweek was five days. Available
time was 24 hours per day, less a 30-minute lunch and two ten-minute breaks during
each of the three shifts, so we needed to produce 2000 units in 21.5 hours or generate a
39-second takt (21.5 × 3600/2000 = 38.7).
We checked the standard work combination table and it listed the cycle time as
28 seconds, but the line balancing studies appeared to be balanced to 25 seconds, so we
were baffled. First, why have two different cycle times? And second, if the cycle time
design is way less than takt, where are their problems? None of these questions could
be answered by the production supervisor or the process engineer—or anyone, for that
matter.
Synchronizing Production, Internally
The Basic Time and Balancing Studies
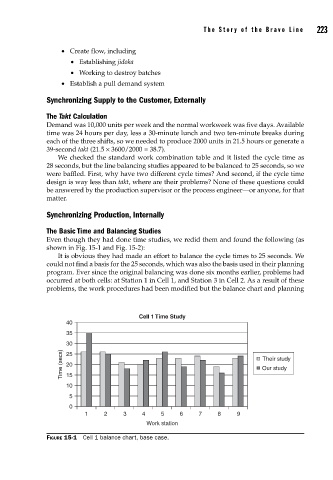
Even though they had done time studies, we redid them and found the following (as
shown in Fig. 15-1 and Fig. 15-2):
It is obvious they had made an effort to balance the cycle times to 25 seconds. We
could not find a basis for the 25 seconds, which was also the basis used in their planning
program. Ever since the original balancing was done six months earlier, problems had
occurred at both cells: at Station 1 in Cell 1, and Station 3 in Cell 2. As a result of these
problems, the work procedures had been modified but the balance chart and planning
Cell 1 Time Study
40
35
30
Time (secs) 25 Their study
20
Our study
15
10
5
0
1 2 3 4 5 6 7 8 9
Work station
FIGURE 15-1 Cell 1 balance chart, base case.