
Page 247 - How To Implement Lean Manufacturing
P. 247
The Story of the Bravo Line 225
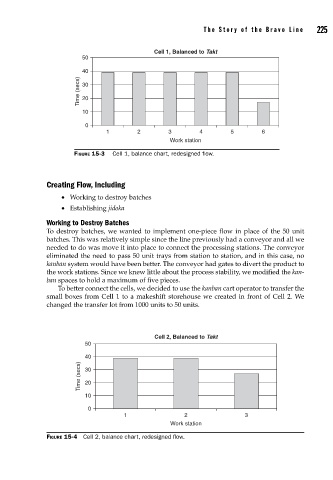
Cell 1, Balanced to Takt
50
40
Time (secs) 30
20
10
0
1 2 3 4 5 6
Work station
FIGURE 15-3 Cell 1, balance chart, redesigned fl ow.
Creating Flow, Including
• Working to destroy batches
• Establishing jidoka
Working to Destroy Batches
To destroy batches, we wanted to implement one-piece flow in place of the 50 unit
batches. This was relatively simple since the line previously had a conveyor and all we
needed to do was move it into place to connect the processing stations. The conveyor
eliminated the need to pass 50 unit trays from station to station, and in this case, no
kanban system would have been better. The conveyor had gates to divert the product to
the work stations. Since we knew little about the process stability, we modified the kan-
ban spaces to hold a maximum of five pieces.
To better connect the cells, we decided to use the kanban cart operator to transfer the
small boxes from Cell 1 to a makeshift storehouse we created in front of Cell 2. We
changed the transfer lot from 1000 units to 50 units.
Cell 2, Balanced to Takt
50
40
Time (secs) 30
20
10
0
1 2 3
Work station
FIGURE 15-4 Cell 2, balance chart, redesigned fl ow.