
Page 273 - How To Implement Lean Manufacturing
P. 273
250 Cha pte r S i x tee n
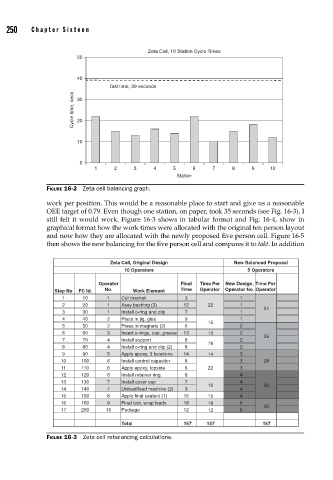
Zeta Cell, 10 Station Cycle Times
50
40
Takt time, 39 seconds
Cycle time, secs 30
20
10
0
1 2 3 4 5 6 7 8 9 10
Station
FIGURE 16-2 Zeta cell balancing graph.
work per position. This would be a reasonable place to start and give us a reasonable
OEE target of 0.79. Even though one station, on paper, took 35 seconds (see Fig. 16-3), I
still felt it would work. Figure 16-3 shows in tabular format and Fig. 16-4, show in
graphical format how the work times were allocated with the original ten person layout
and now how they are allocated with the newly proposed five person cell. Figure 16-5
then shows the new balancing for the five person cell and compares it to takt. In addition
Zeta Cell, Original Design New Balanced Proposal
10 Operators 5 Operators
Operator Final Time Per New Design, Time Per
Step No FC Id. No. Work Element Time Operator Operator No. Operator
1 10 1 Cut bracket 3 1
2 20 1 Assy bushing (3) 12 22 1
31
3 30 1 Install o-ring and clip 7 1
4 40 2 Place in jig, glue 9 1
15
5 50 2 Press in magnets (2) 6 2
6 60 3 Insert o-rings, cap, grease 13 13 2
35
7 70 4 Install support 8 2
16
8 80 4 Install o-ring and clip (2) 8 2
9 90 5 Apply epoxy, 3 locations 14 14 3
10 100 6 Install control capacitor 8 3 28
11 110 6 Apply epoxy, topside 6 22 3
12 120 6 Install retainer ring 8 4
13 130 7 Install cover cap 7 4
10 33
14 140 7 Unload/load machine (2) 3 4
15 150 8 Apply final sealant (1) 15 15 4
16 160 9 Final test, wrap leads 18 18 5
30
17 200 10 Package 12 12 5
Total 157 157 157
FIGURE 16-3 Zeta cell rebalancing calculations.