
Page 345 - Hydrocarbon Exploration and Production Second Edition
P. 345
332 Cost Estimation and Budgets
100
90
80
70
Progress in % 50
60
40
30
20
10
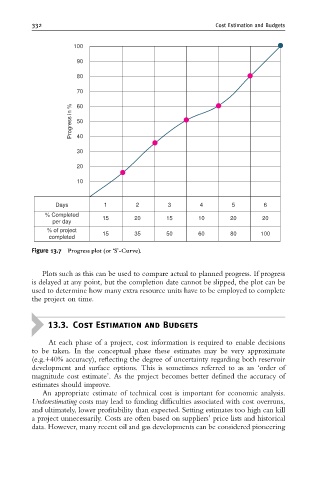
Days 1 2 3 4 5 6
% Completed 15 20 15 10 20 20
per day
% of project 15 35 50 60 80 100
completed
Figure 13.7 Progress plot (or ‘S’-Curve).
Plots such as this can be used to compare actual to planned progress. If progress
is delayed at any point, but the completion date cannot be slipped, the plot can be
used to determine how many extra resource units have to be employed to complete
the project on time.
13.3. Cost Estimation and Budgets
At each phase of a project, cost information is required to enable decisions
to be taken. In the conceptual phase these estimates may be very approximate
(e.g.+40% accuracy), reflecting the degree of uncertainty regarding both reservoir
development and surface options. This is sometimes referred to as an ‘order of
magnitude cost estimate’. As the project becomes better defined the accuracy of
estimates should improve.
An appropriate estimate of technical cost is important for economic analysis.
Underestimating costs may lead to funding difficulties associated with cost overruns,
and ultimately, lower profitability than expected. Setting estimates too high can kill
a project unnecessarily. Costs are often based on suppliers’ price lists and historical
data. However, many recent oil and gas developments can be considered pioneering