
Page 344 - Hydrocarbon Exploration and Production Second Edition
P. 344
Project and Contract Management 331
DAYS
Time
Activity 1 2 3 4 5 6
3
A
1
B
4 2 2
C
4 4
D
TOTAL 3 5 2 2 4 4
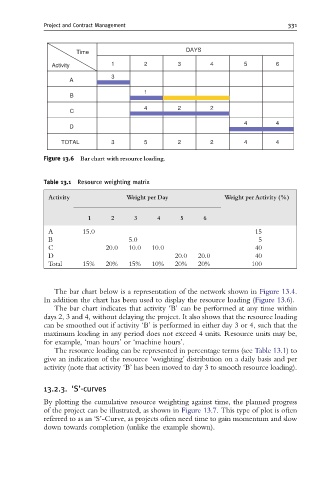
Figure 13.6 Bar chart with resource loading.
Table 13.1 Resource weighting matrix
Activity Weight per Day Weight per Activity (%)
1 2 3 4 5 6
A 15.0 15
B 5.0 5
C 20.0 10.0 10.0 40
D 20.0 20.0 40
Total 15% 20% 15% 10% 20% 20% 100
The bar chart below is a representation of the network shown in Figure 13.4.
In addition the chart has been used to display the resource loading (Figure 13.6).
The bar chart indicates that activity ‘B’ can be performed at any time within
days 2, 3 and 4, without delaying the project. It also shows that the resource loading
can be smoothed out if activity ‘B’ is performed in either day 3 or 4, such that the
maximum loading in any period does not exceed 4 units. Resource units may be,
for example, ‘man hours’ or ‘machine hours’.
The resource loading can be represented in percentage terms (see Table 13.1)to
give an indication of the resource ‘weighting’ distribution on a daily basis and per
activity (note that activity ‘B’ has been moved to day 3 to smooth resource loading).
13.2.3. ‘S’-curves
By plotting the cumulative resource weighting against time, the planned progress
of the project can be illustrated, as shown in Figure 13.7. This type of plot is often
referred to as an ‘S’-Curve, as projects often need time to gain momentum and slow
down towards completion (unlike the example shown).