
Page 343 - Hydrocarbon Exploration and Production Second Edition
P. 343
330 Planning and Control
1 Day 1 Day
Activity
3 Days 2 Days
Critical Path
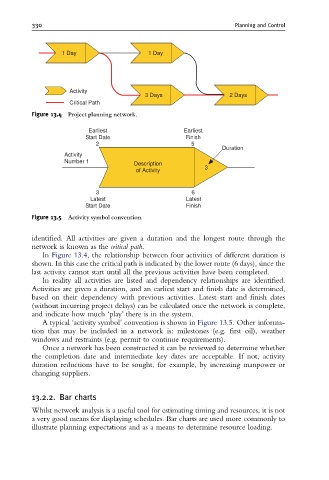
Figure 13.4 Project planning network.
Earliest Earliest
Start Date Finish
2 5
Duration
Activity
Number 1
Description
of Activity 3
3 6
Latest Latest
Start Date Finish
Figure 13.5 Activity symbol convention.
identified. All activities are given a duration and the longest route through the
network is known as the critical path.
In Figure 13.4, the relationship between four activities of different duration is
shown. In this case the critical path is indicated by the lower route (6 days), since the
last activity cannot start until all the previous activities have been completed.
In reality all activities are listed and dependency relationships are identified.
Activities are given a duration, and an earliest start and finish date is determined,
based on their dependency with previous activities. Latest start and finish dates
(without incurring project delays) can be calculated once the network is complete,
and indicate how much ‘play’ there is in the system.
A typical ‘activity symbol’ convention is shown in Figure 13.5. Other informa-
tion that may be included in a network is: milestones (e.g. first oil), weather
windows and restraints (e.g. permit to continue requirements).
Once a network has been constructed it can be reviewed to determine whether
the completion date and intermediate key dates are acceptable. If not, activity
duration reductions have to be sought, for example, by increasing manpower or
changing suppliers.
13.2.2. Bar charts
Whilst network analysis is a useful tool for estimating timing and resources, it is not
a very good means for displaying schedules. Bar charts are used more commonly to
illustrate planning expectations and as a means to determine resource loading.