
Page 379 - Hydrocarbon Exploration and Production Second Edition
P. 379
366 Summary of Risk Analysis Techniques in Exploration and Appraisal
In some cases it is worth defining risk as the product of impact and probability,
still measured in dollars. An event with high impact but low probability, such as a
major plant upset or disaster, will therefore be considered in terms of the product of
the two, which may be considerable, and worth reducing through design effort and
expenditure. This is a technique used in quantitative risk assessment (QRA).
15.2. Summary of Risk Analysis Techniques in
Exploration and Appraisal
In the exploration phase, the key uncertainties are the presence of a petroleum
system through which hydrocarbons could be accumulated in a reservoir, and the
volume of those hydrocarbons, if present. These two uncertainties are combined into
a risked volume by multiplying together the POS and the volumetric range, often
represented by an expectation curve, as presented in Chapters 7 and 14.
In summary the risked volume of hydrocarbon reserves can be calculated as
follows
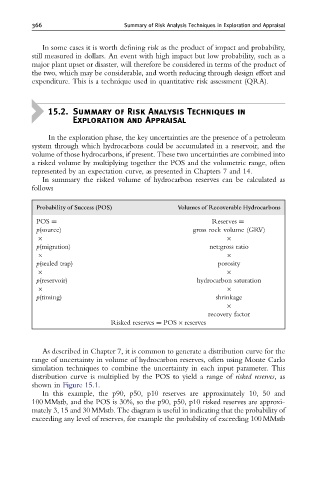
Probability of Success (POS) Volumes of Recoverable Hydrocarbons
POS ¼ Reserves ¼
p(source) gross rock volume (GRV)
p(migration) net:gross ratio
p(sealed trap) porosity
p(reservoir) hydrocarbon saturation
p(timing) shrinkage
recovery factor
Risked reserves ¼ POS reserves
As described in Chapter 7, it is common to generate a distribution curve for the
range of uncertainty in volume of hydrocarbon reserves, often using Monte Carlo
simulation techniques to combine the uncertainty in each input parameter. This
distribution curve is multiplied by the POS to yield a range of risked reserves,as
shown in Figure 15.1.
In this example, the p90, p50, p10 reserves are approximately 10, 50 and
100 MMstb, and the POS is 30%, so the p90, p50, p10 risked reserves are approxi-
mately 3, 15 and 30 MMstb. The diagram is useful in indicating that the probability of
exceeding any level of reserves, for example the probability of exceeding 100 MMstb