
Page 229 - Hydrogeology Principles and Practice
P. 229
HYDC06 12/5/05 5:33 PM Page 212
212 Chapter Six
BO X
Continued
6.3
variability of the porous material at the field scale and, as shown in
the second experiment described below, non-linear and competitive
sorption effects (Rivett & Allen-King 2003).
The second experiment, the emplaced source natural gradient
tracer experiment (Rivett et al. 2001; Rivett & Allen-King 2003),
involved the controlled emplacement below the water table of a
block-shaped source of sand with dimensions of length 0.5 m,
height 1.0 m and width 1.5 m, and containing the chlorinated sol-
vents perchloroethene (PCE), trichloroethene (TCE) and trich-
loromethane (TCM) together with gypsum. Gypsum was added to
provide a continuous source of conservative inorganic tracer as
dissolved sulphate in the aerobic groundwater of the Borden
aquifer. Unlike the first experiment conducted about 150 m away,
and which involved a finite pulse of dissolved organic solutes at low
concentrations, the emplaced source experiment was intended to
provide a simplified, yet realistic analogue of actual solvent con-
taminated sites. Such sites commonly contain residual zones of
dense non-aqueous phase liquid (DNAPL) that continuously gener-
ate dissolved phase organic solute plumes over long time periods.
The gradual dissolution of the residual, multicomponent chlo-
rinated solvent source under natural aquifer conditions caused
organic solute plumes to develop continuously down-gradient.
Source dissolution and three-dimensional plume development were
again monitored via a dense array of 173 multilevel sampling wells
over a 475-day tracer test period. As shown in Fig. 4, organic solute
plumes with concentrations spanning 1–700,000 mgL −1 were
identified. The calculated mean groundwater pore velocity until
322 days was 0.085 m day −1 inferring a travel distance due to
advection alone of 27 m. The dissolved solvent plumes were
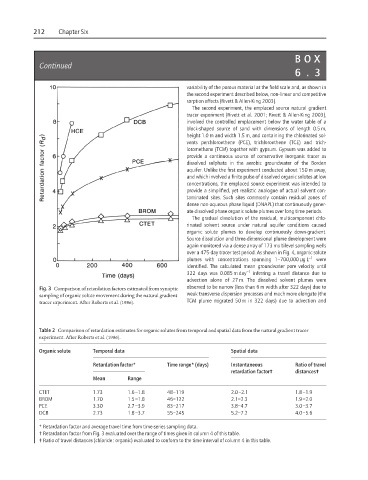
Fig. 3 Comparison of retardation factors estimated from synoptic observed to be narrow (less than 6 m width after 322 days) due to
sampling of organic solute movement during the natural gradient weak transverse dispersion processes and much more elongate (the
tracer experiment. After Roberts et al. (1986). TCM plume migrated 50 m in 322 days) due to advection and
Table 2 Comparison of retardation estimates for organic solutes from temporal and spatial data from the natural gradient tracer
experiment. After Roberts et al. (1986).
Organic solute Temporal data Spatial data
Retardation factor* Time range*(days) Instantaneous Ratio of travel
retardation factor† distances‡
Mean Range
CTET 1.73 1.6–1.8 48–119 2.0–2.1 1.8–1.9
BROM 1.70 1.5–1.8 46–122 2.1–2.3 1.9–2.0
PCE 3.30 2.7–3.9 83–217 3.8–4.7 3.0–3.7
DCB 2.73 1.8–3.7 55–245 5.2–7.2 4.0–5.6
* Retardation factor and average travel time from time-series sampling data.
† Retardation factor from Fig. 3 evaluated over the range of times given in column 4 of this table.
‡ Ratio of travel distances (chloride : organic) evaluated to conform to the time interval of column 4 in this table.