
Page 227 - Hydrogeology Principles and Practice
P. 227
HYDC06 12/5/05 5:33 PM Page 210
210 Chapter Six
for two aromatic amine compounds are shown in If there is no difference in behaviour, then the retar-
Fig. 6.8. Aromatic amines occur as constituents of in- dation factor is equal to 1 and K is 0, in other words
d
dustrial waste waters, for example from dye produc- there is no reaction between the contaminant and
tion, and also as degradation products (metabolites) the soil, sediment or aquifer material. For values of
of pesticides. R greater than 1, attenuation of the contaminant
d
When inspecting contaminant plumes from field species relative to the groundwater is indicated.
data, it is also useful to choose a non-reactive tracer The partition coefficient, K , describes the process
d
such as chloride to represent the advective transport of contaminant sorption from the aqueous phase to
of groundwater for comparison with the contamin- the solid phase. Qualitatively, K is equal to the mass
d
ant behaviour. Examples of retardation factors calcu- of chemical sorbed to the solid phase (per unit mass of
lated from both spatial and temporal field data for solid) per concentration of chemical in the aqueous
organic solutes in a sand aquifer are given in Box 6.3. phase. Values of K are found empirically from labor-
d
BO X
Controlled field experiments to investigate transport of organic solutes
6.3
Hydrophobic sorption of organic solutes was examined in detail as background levels. The monitoring network system consisted of a
part of two large-scale field experiments to investigate the natural dense network of 340 multilevel sampling devices. The horizontal
gradient transport of organic solutes in groundwater. The experi- spacing of the multilevel wells varied from 1.0 to 4.0 m, while the
ments were conducted in an unconfined sand aquifer at the vertical spacing of the sampling points varied from 0.2 to 0.3 m,
Canadian Forces Base Borden, Ontario, and are described in detail again chosen to be consistent with the estimated scales of hydraulic
in papers by Mackay et al. (1986), Roberts et al. (1986), Rivett et al. conductivity.
(2001) and Rivett & Allen-King (2003). The aquifer is about 9 m The closely spaced array of sampling points gave an unparalleled
thick and is underlain by a thick, silty clay aquitard. The water table opportunity to study the morphology of the developing solute
has an average horizontal gradient of about 0.005 that may vary plumes and their attenuation by sorption and biodegradation by
seasonally by as much as a factor of 2 (Rivett et al. 2001). The comparison with chloride introduced as a non-reactive tracer. Equal
aquifer is composed of clean, well-sorted, fine- to medium-grained concentration contour plots of vertically averaged solute concentra-
sand of glacio-lacustrine origin. Although the aquifer is fairly homo- tion for the chloride ion at 647 days after injection and carbon
geneous, undisturbed cores reveal distinct bedding features. The tetrachloride (CTET) and tetrachloroethene (PCE) at 633 days after
bedding is primarily horizontal and parallel, although some cross-
bedding and convolute bedding occur. Clay size fractions in the
sand are very low and the organic carbon content (0.02%), specific
2 −1
surface area (0.8 m g ) and cation exchange capacity (0.52 meq
−1
(100 g) ) of the aquifer solids are all low. The bulk density of the
sand was estimated at 1.81 g cm −3 and the average porosity at
0.33. The hydraulic conductivity varies by approximately an order of
magnitude with depth as a consequence of layering of the sand
material. The geometric means of the hydraulic conductivity for
cores sampled at two locations were similar at about 10 −4 ms −1
(Mackay et al. 1986; Sudicky 1986).
The first experiment, the Stanford-Waterloo natural gradient
tracer experiment (Mackay et al. 1986; Roberts et al. 1986), was
designed with nine injection wells, each slotted and screened within
the saturated zone (Fig. 1). Five halogenated organic solutes were
chosen representing a range of expected mobilities as measured by
their octanol-water partition coefficient (K ) values (Table 1).
OW
3
At the start of the experiment, approximately 12 m of solution
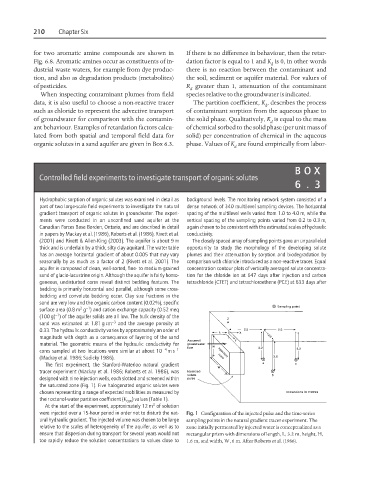
were injected over a 15-hour period in order not to disturb the nat- Fig. 1 Configuration of the injected pulse and the time-series
ural hydraulic gradient. The injected volume was chosen to be large sampling points in the natural gradient tracer experiment. The
relative to the scales of heterogeneity of the aquifer, as well as to zone initially permeated by injected water is conceptualized as a
ensure that dispersion during transport for several years would not rectangular prism with dimensions of length, L, 3.2 m, height, H,
too rapidly reduce the solution concentrations to values close to 1.6 m, and width, W, 6 m. After Roberts et al. (1986).