
Page 228 - Hydrogeology Principles and Practice
P. 228
HYDC06 12/5/05 5:33 PM Page 211
Groundwater quality and contaminant hydrogeology 211
BO X
Continued
6.3
Table 1 Injected organic solutes used in the natural gradient tracer experiment and their associated sorption properties.
After Mackay et al. (1986).
−1
Solute Injected concentration (mg L ) Injected mass (g) Octanol-water partition coefficient K
OW
Chloride (tracer) 892 10,700 –
Bromoform (BROM) 0.032 0.38 200
Carbon tetrachloride (CTET) 0.031 0.37 500
Tetrachloroethene (PCE) 0.030 0.36 400
1,2-Dichlorobenzene (DCB) 0.332 4.0 2500
Hexachloroethane (HCE) 0.020 0.23 4000
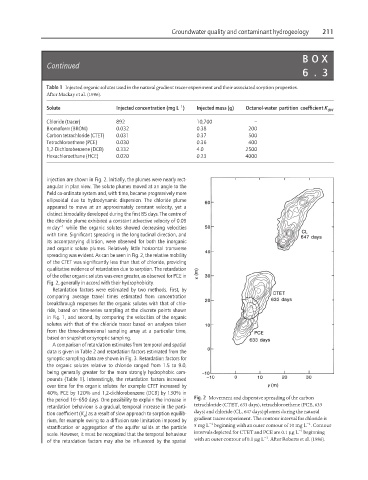
injection are shown in Fig. 2. Initially, the plumes were nearly rect-
angular in plan view. The solute plumes moved at an angle to the
field co-ordinate system and, with time, became progressively more
ellipsoidal due to hydrodynamic dispersion. The chloride plume
appeared to move at an approximately constant velocity, yet a
distinct bimodality developed during the first 85 days. The centre of
the chloride plume exhibited a constant advective velocity of 0.09
m day −1 while the organic solutes showed decreasing velocities
with time. Significant spreading in the longitudinal direction, and
its accompanying dilution, were observed for both the inorganic
and organic solute plumes. Relatively little horizontal transverse
spreading was evident. As can be seen in Fig. 2, the relative mobility
of the CTET was significantly less than that of chloride, providing
qualitative evidence of retardation due to sorption. The retardation
of the other organic solutes was even greater, as observed for PCE in
Fig. 2, generally in accord with their hydrophobicity.
Retardation factors were estimated by two methods. First, by
comparing average travel times estimated from concentration
breakthrough responses for the organic solutes with that of chlo-
ride, based on time-series sampling at the discrete points shown
in Fig. 1, and second, by comparing the velocities of the organic
solutes with that of the chloride tracer based on analyses taken
from the three-dimensional sampling array at a particular time,
based on snapshot or synoptic sampling.
A comparison of retardation estimates from temporal and spatial
data is given in Table 2 and retardation factors estimated from the
synoptic sampling data are shown in Fig. 3. Retardation factors for
the organic solutes relative to chloride ranged from 1.5 to 9.0,
being generally greater for the more strongly hydrophobic com-
pounds (Table 1). Interestingly, the retardation factors increased
over time for the organic solutes: for example CTET increased by
40%, PCE by 120% and 1,2-dichlorobenzene (DCB) by 130% in
Fig. 2 Movement and dispersive spreading of the carbon
the period 16–650 days. One possibility to explain the increase in
tetrachloride (CTET, 633 days), tetrachloroethene (PCE, 633
retardation behaviour is a gradual, temporal increase in the parti-
days) and chloride (CL, 647 days) plumes during the natural
tion coefficient (K ) as a result of slow approach to sorption equilib-
d
rium, for example owing to a diffusion rate limitation imposed by gradient tracer experiment. The contour interval for chloride is
−1
−1
5mgL beginning with an outer contour of 10 mg L . Contour
stratification or aggregation of the aquifer solids at the particle
−1
intervals depicted for CTET and PCE are 0.1 µgL beginning
scale. However, it must be recognized that the temporal behaviour
−1
with an outer contour of 0.1 µgL . After Roberts et al. (1986).
of the retardation factors may also be influenced by the spatial