
Page 231 - Hydrogeology Principles and Practice
P. 231
HYDC06 12/5/05 5:33 PM Page 214
214 Chapter Six
Fig. 6.8 Column breakthrough curves for 2-nitroaniline
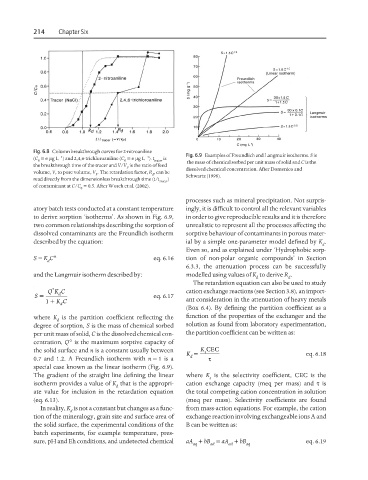
Fig. 6.9 Examples of Freundlich and Langmuir isotherms. S is
−1
−1
(C = 6 µgL ) and 2,4,6-trichloroaniline (C = 6 µgL ). t is
0 0 tracer the mass of chemical sorbed per unit mass of solid and C is the
the breakthrough time of the tracer and V/V is the ratio of feed
P dissolved chemical concentration. After Domenico and
volume, V, to pore volume, V . The retardation factor, R , can be
P d Schwartz (1998).
read directly from the dimensionless breakthrough time (t/t )
tracer
of contaminant at C/C = 0.5. After Worch et al. (2002).
0
processes such as mineral precipitation. Not surpris-
atory batch tests conducted at a constant temperature ingly, it is difficult to control all the relevant variables
to derive sorption ‘isotherms’. As shown in Fig. 6.9, in order to give reproducible results and it is therefore
two common relationships describing the sorption of unrealistic to represent all the processes affecting the
dissolved contaminants are the Freundlich isotherm sorptive behaviour of contaminants in porous mater-
described by the equation: ial by a simple one-parameter model defined by K .
d
Even so, and as explained under ‘Hydrophobic sorp-
S = K C n eq. 6.16 tion of non-polar organic compounds’ in Section
d
6.3.3, the attenuation process can be successfully
and the Langmuir isotherm described by: modelled using values of K to derive R .
d d
The retardation equation can also be used to study
° cation exchange reactions (see Section 3.8), an import-
QK C
=
S d eq. 6.17
+
1 KC ant consideration in the attenuation of heavy metals
d
(Box 6.4). By defining the partition coefficient as a
where K is the partition coefficient reflecting the function of the properties of the exchanger and the
d
degree of sorption, S is the mass of chemical sorbed solution as found from laboratory experimentation,
per unit mass of solid, C is the dissolved chemical con- the partition coefficient can be written as:
centration, Q° is the maximum sorptive capacity of
the solid surface and n is a constant usually between K CEC
s
K = eq. 6.18
d
0.7 and 1.2. A Freundlich isotherm with n = 1 is a τ
special case known as the linear isotherm (Fig. 6.9).
The gradient of the straight line defining the linear where K is the selectivity coefficient, CEC is the
s
isotherm provides a value of K that is the appropri- cation exchange capacity (meq per mass) and τ is
d
ate value for inclusion in the retardation equation the total competing cation concentration in solution
(eq. 6.13). (meq per mass). Selectivity coefficients are found
In reality, K is not a constant but changes as a func- from mass-action equations. For example, the cation
d
tion of the mineralogy, grain size and surface area of exchange reaction involving exchangeable ions A and
the solid surface, the experimental conditions of the B can be written as:
batch experiments, for example temperature, pres-
sure, pH and Eh conditions, and undetected chemical aA + bB = aA + bB eq. 6.19
aq ad ad aq