
Page 112 - Industrial Power Engineering and Applications Handbook
P. 112
Starting and control of slip-ring induction motors 5/93
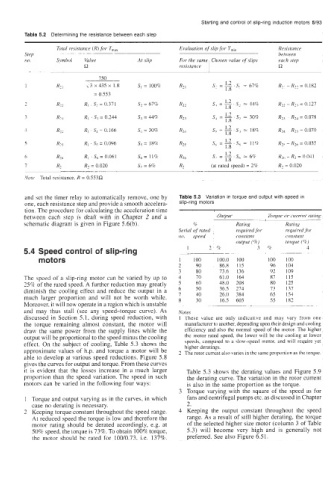
Table 5.2 Determining the resistance between each step
Total resistance (R) for T,,, Evaluation of slip for T,,, Resistance
Step between
no. Symbol Value At slip each step
R resistance R
~-
750
I R21 li'5 x 435 x 1.8 SI = 100%
= 0.553
7 Rzz R, . S2 = 0.371 Sl = 61% s, = =s, - 44% Rz2 - Rz3 = 0.127
1.8
I R22
3 R23 R1 S3 = 0.244 s3 = 44% R23 S, = 1.2 . S3 - 308 Rz3 - R,, = 0.078
1.8
4 R24 R,. S, = 0.166 S, = 30% RZ4 s -'.2.s, - 18% R,, ~ RZ5 = 0.070
~ 1.8
1.2
5 R25 s 6 - ---.s, = 11% Rz~
- R26 = 0.035
1.8
6 RZh R, . S6 = 0.061 S6 = 11% R26 S, ='.2.S, -6% RZ6 - RZ = 0 041
1.8
7 R2 R, = 0.020 S7 = 6% R? (at rated speed) = 2% R, = 0.020
~
Note Total resistance, R = 0.553R
and set the timer relay to automatically remove, one by Table 5.3 Variation in torque and output with speed in
one, each resistance step and provide a smooth accelera- slip-ring motors
tion. The procedure for calculating the acccleration time
between each step is dealt with in Chapter 2 and a output Torque or current rating
schematic diagram is given in Figure 5.6(b). 1 % Rating Rating
Seriai~of rated required for required for
no. speed constant constant
output (5%) torque (Si
5.4 Speed control of slip-ring 1 2 % 3 8 4
motors 100.0 100 100 100
86.8 115 96 104
73.6 136 92 109
The speed of a slip-ring motor can be varied by up to 61.0 164 87 115
25% of the rated speed. A further reduction may greatly 5 60 48.0 208 80 125
diminish the cooling effect and reduce the output in a 6 50 36.5 274 73 131
much larger proportion and will not be worth while. 7 40 26.0 384 65 154
16.5 605
182
30
55
8
Moreover, it will now operate in a region which is unstable
and may thus stall (see any speed-torque curve). As Notes
discussed in Section 5.1, during speed reduction, with 1 These value are only indicative and may vary from one
the torque remaining almost constant, the motor will manufacturer to another, depending upon their design and cooling
draw the same power from the supply lines while the efficiency and also the normal speed of the motor. The higher
output will be proportional to the speed minus the cooling the motor rated speed, the lower will be the cooling at lower
effect. On the subject of cooling, Table 5.3 shows the speeds, compared to a slow-speed motor, and will require yet
higher deratings.
approximate values of h.p. and torque a motor will be 2 The rotor current also varies in the same proportion as the torque.
able to develop at various speed reductions. Figure 5.8
gives the curves for output and torque. From these curves
it is evident that the losses increase in a much larger Table 5.3 shows the derating values and Figure 5.9
proportion than the speed variation. The speed in such the derating curve. The variation in the rotor current
motors can be vaned in the following four ways: is also in the same proportion as the torque.
3 Torque varying with the square of the speed as for
1 Torque and output varying as in the curves, in which fans and centrifugal pumps etc. as discussed in Chapter
case no derating is necessary. 2.
2 Keeping torque constant throughout the speed range. 4 Keeping the output constant throughout the speed
At reduced speed the torque is low and therefore the range. As a result of still higher derating, the torque
motor rating should be derated accordingly, e.g. at of the selected higher size motor (column 3 of Table
50% speed, the torque is 73%. To obtain 100% torque, 5.3) will become very high and is generally not
the motor should be rated for 100/0.73, i.e. 137%. preferred. See also Figure 6.5 1.