
Page 44 - Industrial Process Plant Construction Estimating and Man Hour Analysis
P. 44
14 Industrial process plant construction estimating and man-hour analysis
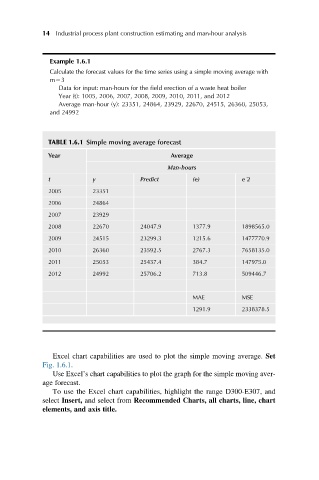
Example 1.6.1
Calculate the forecast values for the time series using a simple moving average with
m¼3
Data for input: man-hours for the field erection of a waste heat boiler
Year (t): 1005, 2006, 2007, 2008, 2009, 2010, 2011, and 2012
Average man-hour (y): 23351, 24864, 23929, 22670, 24515, 26360, 25053,
and 24992
TABLE 1.6.1 Simple moving average forecast
Year Average
Man-hours
t y Predict (e) e^2
2005 23351
2006 24864
2007 23929
2008 22670 24047.9 1377.9 1898565.0
2009 24515 23299.3 1215.6 1477770.9
2010 26360 23592.5 2767.3 7658135.0
2011 25053 25437.4 384.7 147975.0
2012 24992 25706.2 713.8 509446.7
MAE MSE
1291.9 2338378.5
Excel chart capabilities are used to plot the simple moving average. Set
Fig. 1.6.1.
Use Excel’s chart capabilities to plot the graph for the simple moving aver-
age forecast.
To use the Excel chart capabilities, highlight the range D300-E307, and
select Insert, and select from Recommended Charts, all charts, line, chart
elements, and axis title.