
Page 45 - Industrial Process Plant Construction Estimating and Man Hour Analysis
P. 45
Introduction to construction statistics using Excel Chapter 1 15
28,000
Axis title 24,000
26,000
22,000
20,000
1 2 3 4 5
Axis title
Series1 Series2
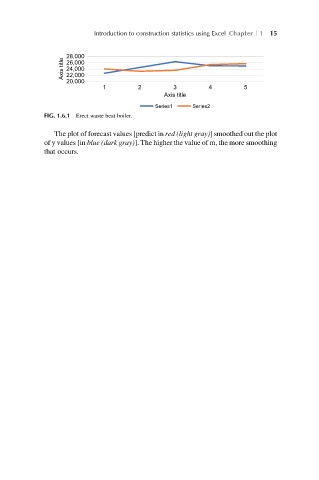
FIG. 1.6.1 Erect waste heat boiler.
The plot of forecast values [predict in red (light gray)] smoothed out the plot
of y values [in blue (dark gray)]. The higher the value of m, the more smoothing
that occurs.