
Page 50 - Industrial Process Plant Construction Estimating and Man Hour Analysis
P. 50
20 Industrial process plant construction estimating and man-hour analysis
1.7.1 The mean, variance and standard deviation measures
of central tendency
The formula for the variance is
2
2
2
S ¼ y1 Y þ Y2þY 2 þ⋯þ Yn Y =n 1
and summation notation
n
X
^ ^
S 2 ¼ ð yi yÞ 2=n 1
i¼1
Excel function: The sample variance is calculated in Excel using the func-
tion VAR.
VAR (number 1, number 2): Estimates variance based on a sample
(ignores logical values and text in the sample).
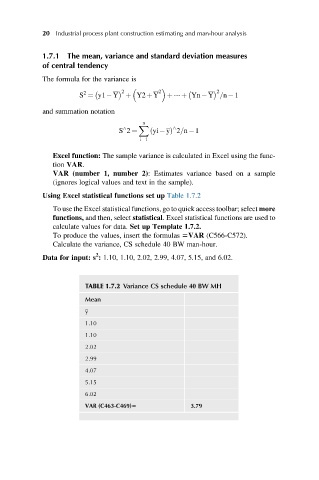
Using Excel statistical functions set up Table 1.7.2
To use the Excel statistical functions, go to quick access toolbar; select more
functions, and then, select statistical. Excel statistical functions are used to
calculate values for data. Set up Template 1.7.2.
To produce the values, insert the formulas 5VAR (C566-C572).
Calculate the variance, CS schedule 40 BW man-hour.
Data for input: s : 1.10, 1.10, 2.02, 2.99, 4.07, 5.15, and 6.02.
2
TABLE 1.7.2 Variance CS schedule 40 BW MH
Mean
y
1.10
1.10
2.02
2.99
4.07
5.15
6.02
VAR (C463-C469)5 3.79